

3. Grouping & Aggregation
2. A simple data analytics example
3.1 Compute total sales for each salesperson in 2024
In Section 2.4, the grouping method is already used to compute total sales amount, without a grouping condition.
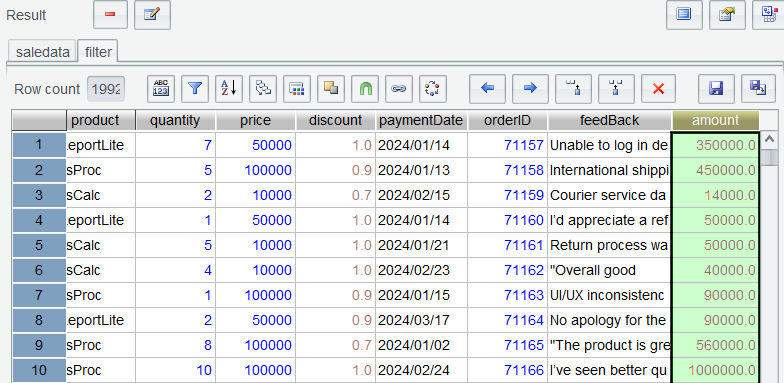
Like what we did in Section 2.2 and Section 2.3, perform filtering to get records in the year 2024 and add amount column named amount through adding a computed column:
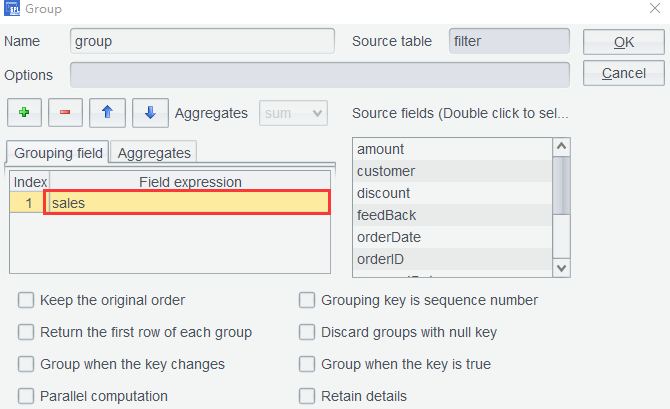
Step 1: Place cursor on salesperson column ( sales ) and click Group icon. The grouping field is automatically displayed in the popped-up window:
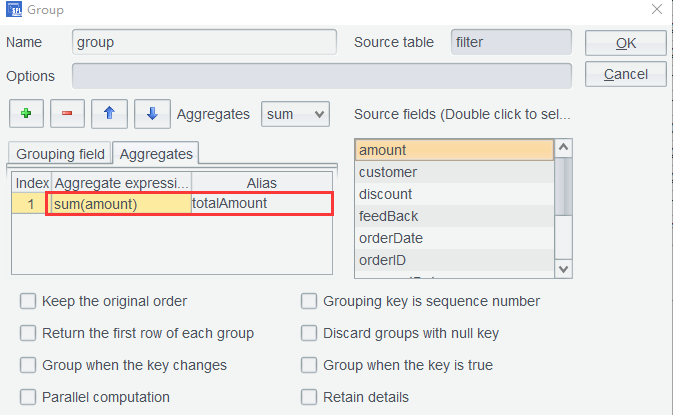
Step 2: Switch to Aggregates tab and add total sales value totalAmount :
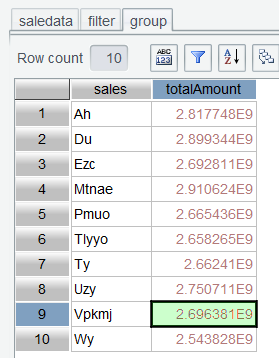
Click OK and we obtain sales amount for each salesperson in the year 2024:
3.2 Salesperson contribution proportion
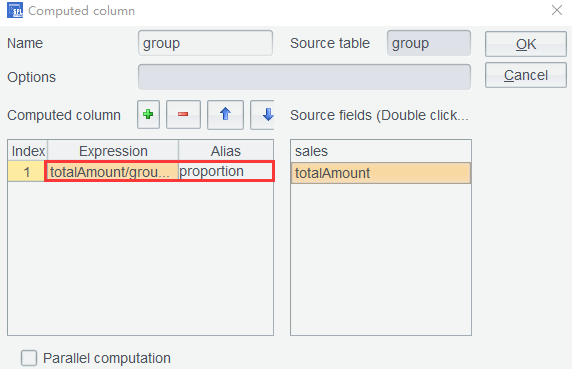
To obtain contribution proportion of each salesperson, you need to compute the ratio of each to the total sales based on group table. Click Computed Column on group table and set expression as totalAmount/group.sum(totalAmount) and alias as proportion:
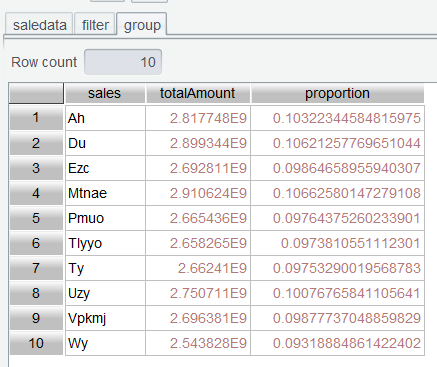
Click OK and a new column named proportion is displayed in group table:
3.3 Select top3 salespeople
In Section 2.3, we explained how to find top N rankings through sorting on the interface. Here we use top() function to get the top 3. Enter expression group.top(-3;totalAmount) in the Edit Command Zone, execute it, and get the top 3:
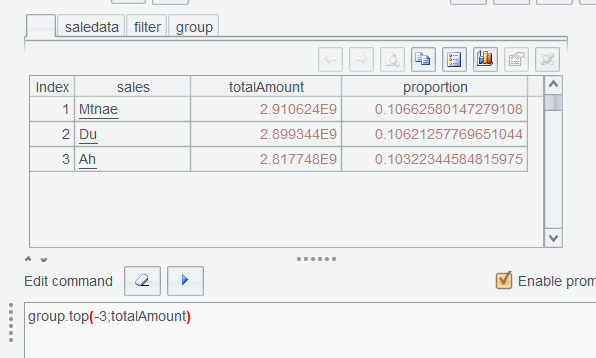
If top() function sorts records by amount ( totalAmount )in ascending order, it gets the bottom 3. So, in the above expression, the opposite direction is specified through -3 (a negative represents the other direction) to get the top 3. Note that semicolon is used here to separate parameters and means returning the whole data rows. You can also use comma to directly return values of the sorting expression. Find more uses about top().
3.4 Select the best-selling product (by frequency of occurrence)
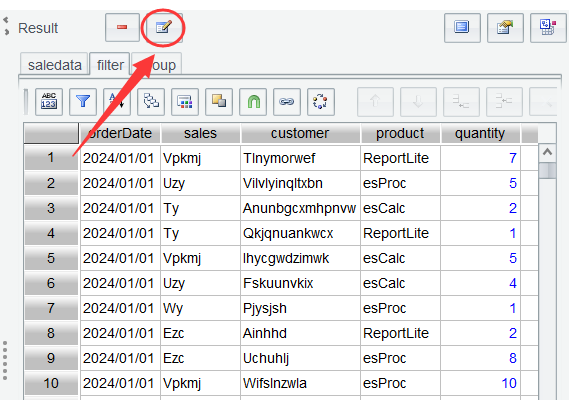
Obviously, you need to regroup filter table by product and perform count. The default-generated table name, after multiple computations, becomes easy to confuse or makes it easy to get confused which step the current table belongs to. To avoid the confusions, the filter table is renamed data2024 , a business meaningful name. Select filter and click Rename icon:
In the popped-up dialog box, enter a new table name, as shown below:
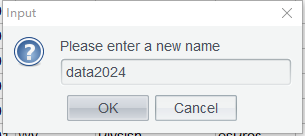
Click OK and filter is changed to data2024 :
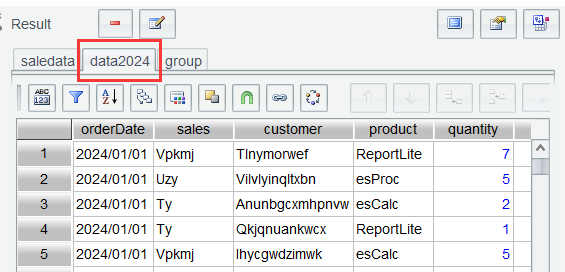
Since we need to group rows by product , the current group table becomes useless. Select group and click the Minus icon, which represents Delete action, before Rename icon to delete the group table.
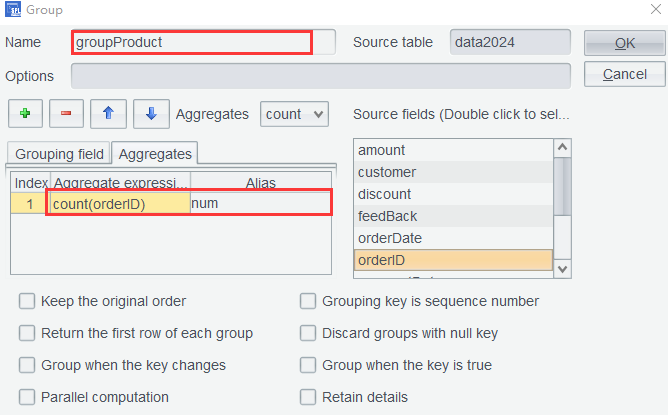
Then select data2024 , place cursor on column product , click Group, set aggregate expression to perform the count, and set table name as the business meaningful groupProduct :
Click OK and a summary table grouped by product :
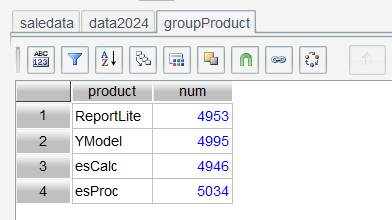
Now rows are grouped and summarized by product . As the current product count is very small, you can easily find the best-selling product. But if there is a large number of products, you can use maxp() function to obtain the target in Edit Command Zone.
3.5 Compute total sales amount and sales quantity per salesperson per year
Table saleData only has column orderDate , so you need to use year() function to get the year and use it as the grouping condition.
Step 1: Perform grouping settings for table saleData , as shown below:
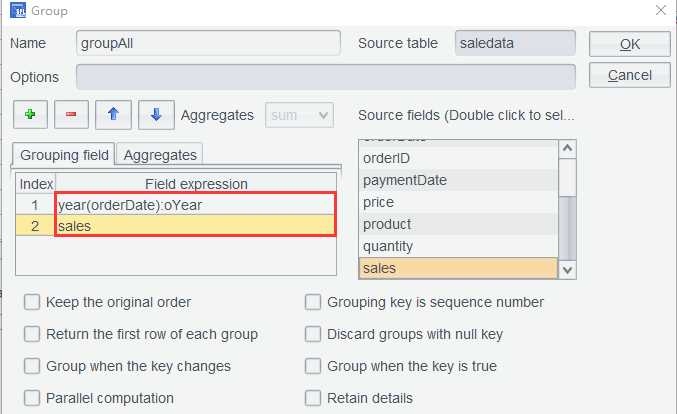
Note that in the first row a colon is used after the grouping expression to introduce the grouping field alias.
Step 2: Set aggregate expression:
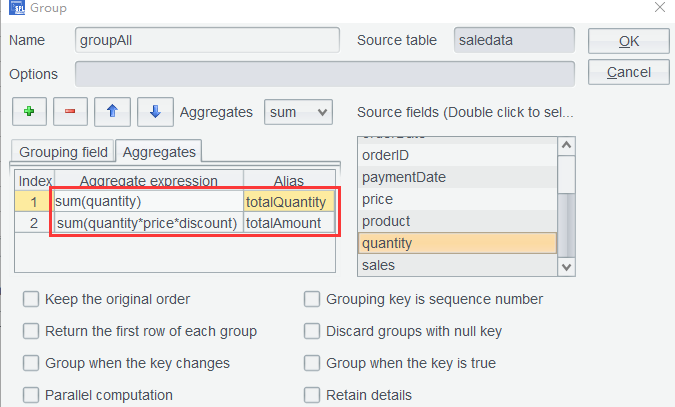
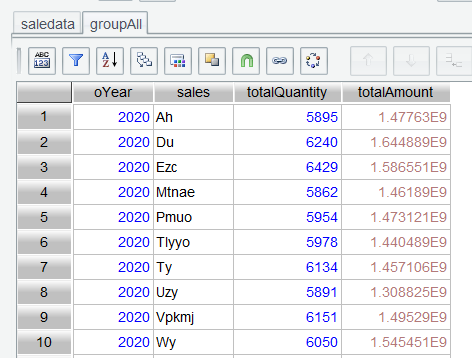
In the second row, formula quantity*price*discount is used in the aggregate expression to compute sum. If you do not care about the intermediate steps, there is no need to add a computed column before performing the grouping. Click OK to get the grouping result:
3.6 Find top3 salespeople in each year
In Section 3.5’s groupAll table, the yearly total sales ( totalAmount ) are computed for each salesperson. Now in order to find the top3 salespeople in each year in terms of amount, you need to group the table by oYear . Unlike a database grouping operation that requires specifying the aggregate expression, SPL WIN offers a flexible method, which retains details records without performing aggregation.
Step 1: Set grouping condition, as shown below:
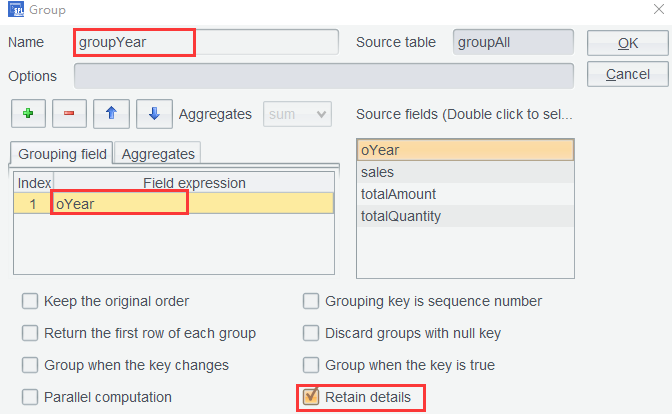
Note: During interface operations, to facilitate editing when performing consecutive identical operations, the editing environment from the previous step will be retained for subsequent steps. Here the current grouping does not require aggregate values, so check and remove the aggregation expression from the previous step.
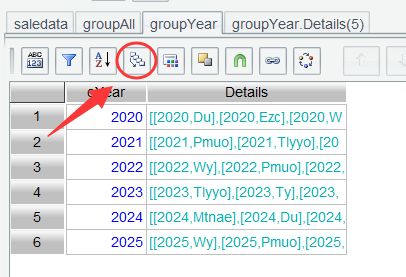
Step 2: Click OK and get a details table grouped by year:
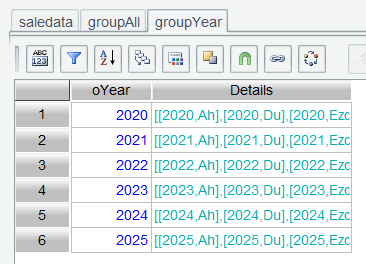
The details data in each group is stored under the auto-generated Details column. As the above screenshot shows, data in Details column displays a different color, indicating they still exist in the form a table sequence. Double-click the details of the year 2021 (the table sequence’s second row):
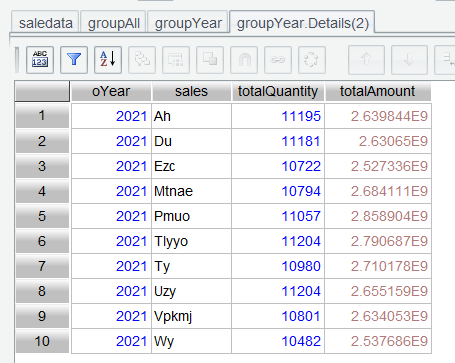
The opened details table has a different name, a compound one, whose structure is parent table.Details (row number).
Step 3: To get the annual top3, sort the details table by totalAmount :
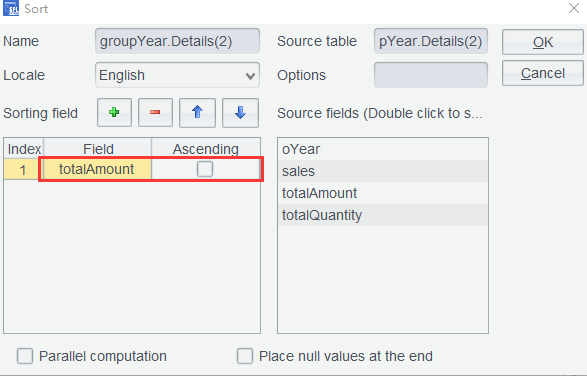
Note: Specify the sorting direction as descending to get the top3.
Click OK to get a sorted 2021details table:
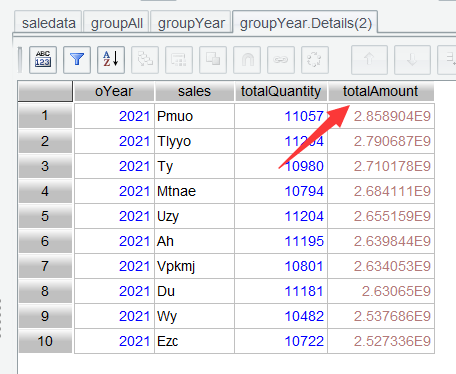
One question: do you need to open each year’s details table one by one to sort them? The answer is no. Operations in the interface of a certain details table are synchronized to all details tables under their parent table . That is to say, details table of all years are sorted after the sorting operation is executed. To check the effect, open 2024 details table:
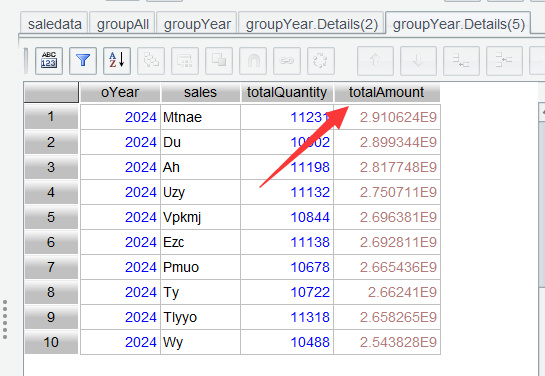
The 2024 details table is also sorted by totalAmount . Now the annual top3 can be obtained.
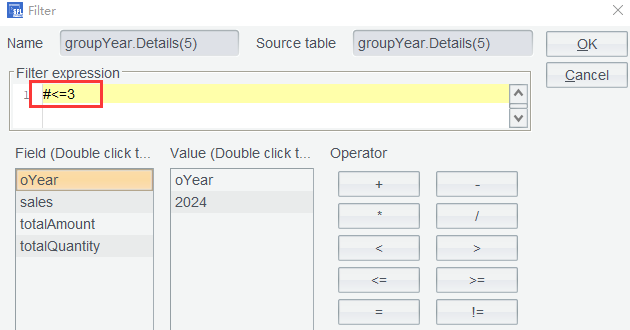
Step 4: Perform Filter on details table groupYear.Details(5) to get the top3:
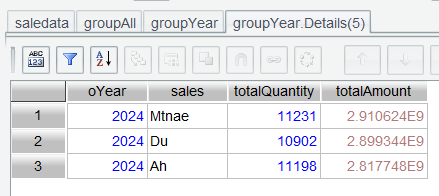
Click OK to get top3 in 2024:
At this point each year’s details table under groupYear has been filtered and their top3s have been obtained. Yet these details tables are still subtables and inconvenient to view.
Step 5: Select table groupYear and click Concatenate Details Data icon (as shown below):
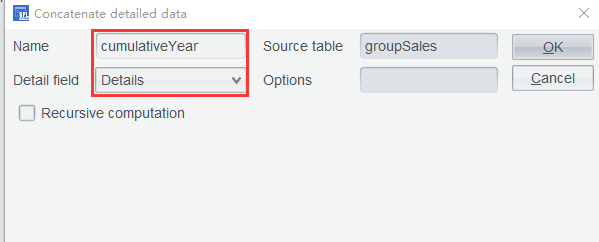
Set name for the result table of concatenating those subtables and specifying the details field:
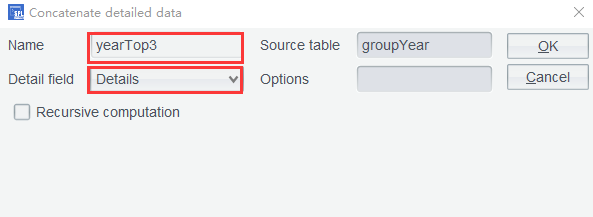
Click OK and get records of annual top 3 salespeople.
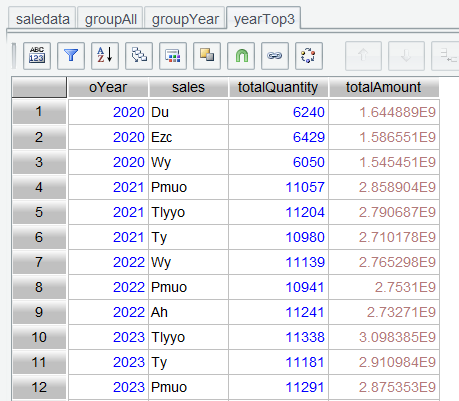
3.7 Select the salesperson who ranked top3 most frequently
In Section 3.6, we obtained the annual top3 ( yearTop3 ). To find the salesperson who appears most frequently in top3 rankings, we need to group records in yearTop3 by sales field and count the ranking frequency.
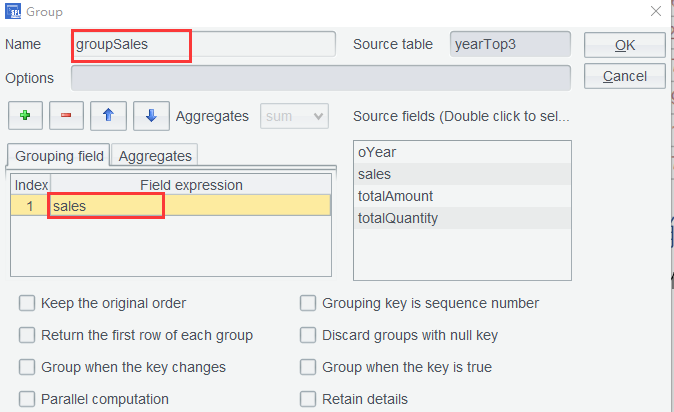
Step 1: Select yearTop3 and configure the grouping operations as the following screenshot shows:
Set the aggregation operation as count:
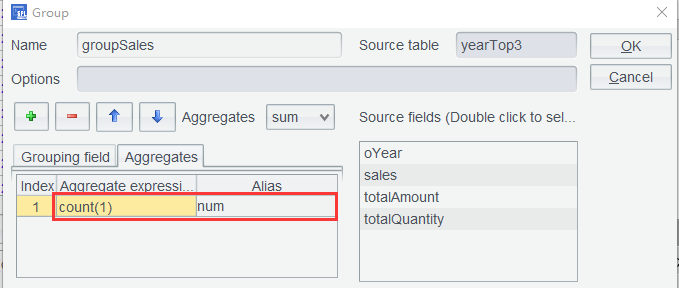
Click OK and grouped table groupSales is generated:
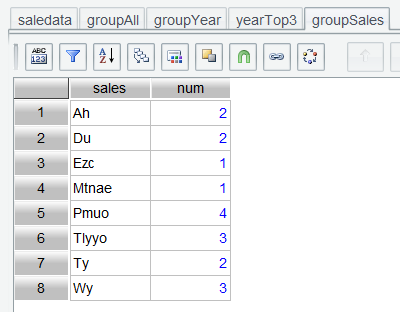
Step 2: As the current groupSales table has a very small number of rows, we can directly find Pmuo, the salesperson who ranked top3 most frequently. If the row count in the table is huge, we need to use expression groupSales.maxp(num) to get the target salesperson.
3.8 Select the salesperson ranked top3 for three consecutive years
To find the salesperson who appears in top3 rankings for three consecutive years, we need to re-sort yearTop3 table by sales field and then compute the number of consecutive ranking years through a computed column.
Step 1: Select yearTop3 table generated in Section 3.7, place cursor on sales column, click Group icon, name the grouped table groupSales , and check Retain details:
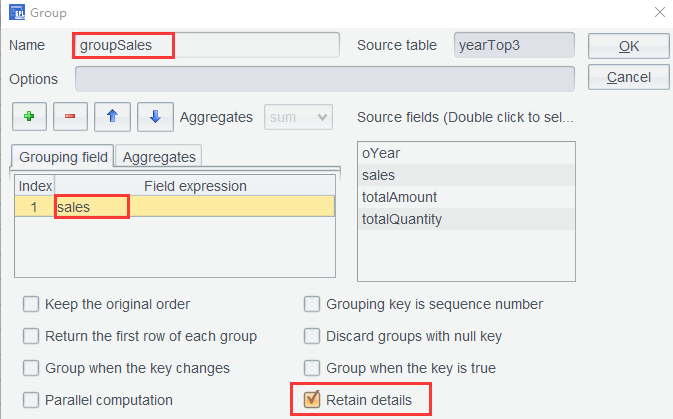
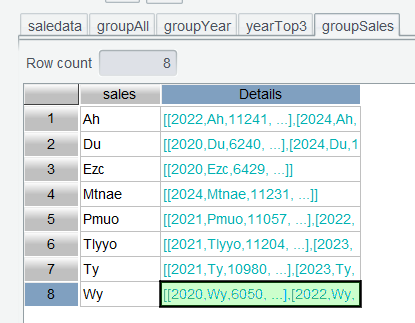
By checking the Retain details option, there is no need to configure the aggregation. You just Click OK and get the result set grouped by salesperson:
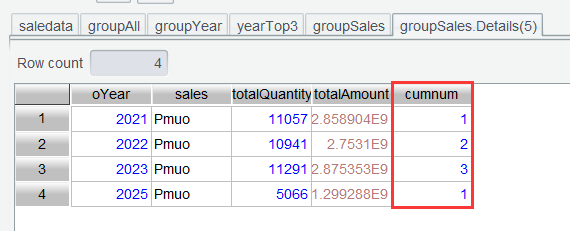
Step 2: Similar to the sorting and filtering operations performed on details tables in Section 3.6, here we just need to add a computed column to a details table and set expression if(oYear==oYear[-1]+1, cumnum[-1]+1, 1) to compute the cumulative count of appearances on the rankings:
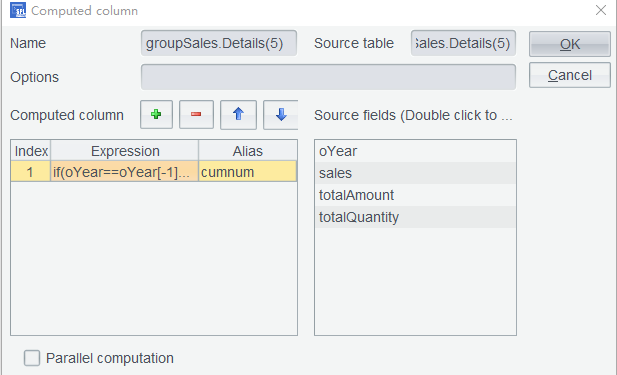
Since yearTop3 ’s oYear column is already ordered, no sorting operation on it is configured for adding a computed column in the details table. Click OK and the cumulative count of appearances on the rankings are computed for all details tables:
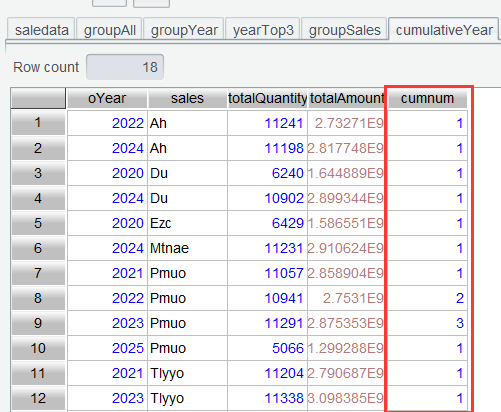
Step 3: Then on the groupSales table where the cumulative counts are ready, concatenate its details data store them as cumulativeYear :
Click OK and get the cumulative count table ( cumulativeYear ):
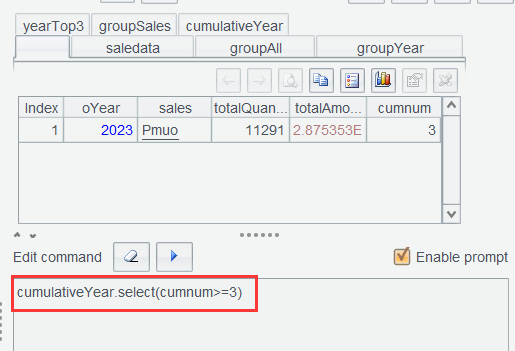
Step 4: Select records meeting condition cumnum>=3. We can perform the filtering operation in the interface or directly using select() function in the Edit Command Zone:
/
Learning point: What does oYear[-1] mean?
oYear[-1] references oYear field value of the current row’s preceding one. Correspondingly, oYear[1] references oYear field value of the current row’s next one. This is the unique syntax for relative position reference in SPL. It is often used in computing scenarios to access a neighboring data row.
3.9 Aggregation according to multiple order amount ranges
Divide order amounts into three ranges: those greater than or equal to 5 million (labeled as B for Big), those between 1 million and 5 million (labeled as M for Middle), and those less than 1 million (labeled as S for Small). Then, compute the number of orders and the total amount for each of the big, medium, and small order category in 2024.
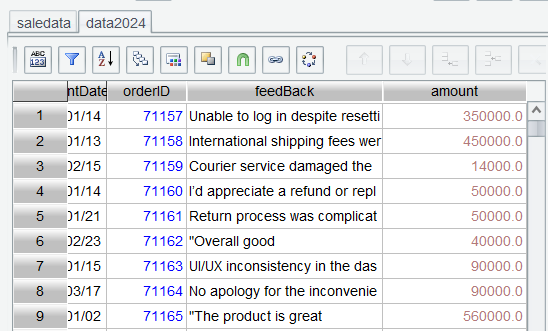
Step 1: Perform filtering on saledata to get a 2024 data table ( data2024 ) and add computed column amount :
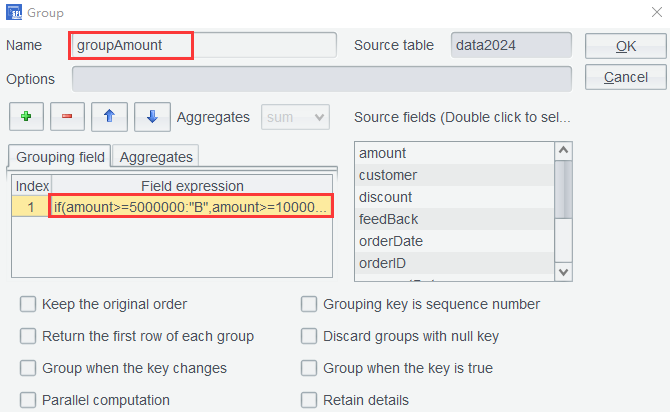
Step 2: Perform grouping on data2024 by setting grouping expression if(amount>=5000000:"B",amount>=1000000:"M";"S"):type:
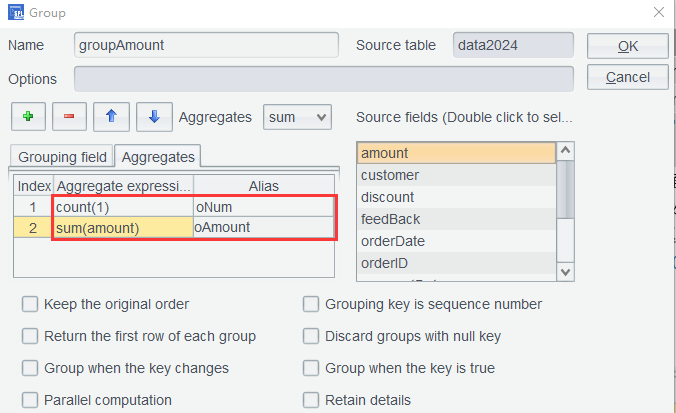
And the aggregate expression:
Click OK and get a summary table grouped by the specified amount ranges:
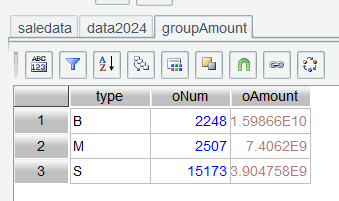
Learning point: if() returns a value according to the result of boolean expression. Find uses of the function HERE.
SPL Official Website 👉 https://www.esproc.com
SPL Feedback and Help 👉 https://www.reddit.com/r/esProcSPL
SPL Learning Material 👉 https://c.esproc.com
SPL Source Code and Package 👉 https://github.com/SPLWare/esProc
Discord 👉 https://discord.gg/sxd59A8F2W
Youtube 👉 https://www.youtube.com/@esProc_SPL

