

2. A simple data analytics example
2.1 Data information
Open a company’s sales data table (saledata.csv) in Excel. Below is its content:
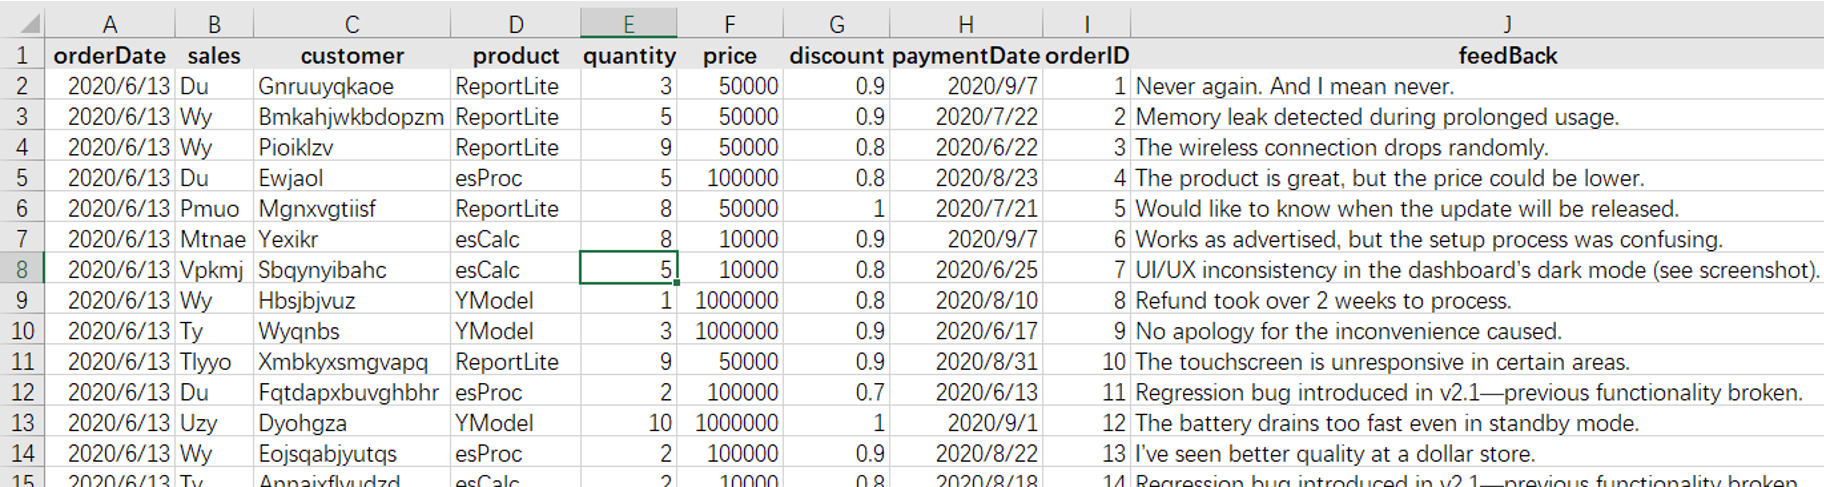
The bold information in the first row is usually column descriptions, often called columns names. They are not the data. In the esProc interface, columns are called fields, which is a database term; and data rows are called records, which begin from the 2nd row.
Descriptions of columns in saledata.csv:
| Column | Description |
|---|---|
| orderID | Order IDs, whose values form a natural number sequence and which correspond to data row numbers in order. |
| orderDate | Order dates. |
| sales | Salesperson. |
| customer | Customers. |
| product | Products. |
| quantity | Order quantities. |
| price | Order prices. |
| discount | Order discounts. |
| paymentDate | Payment dates. |
| feedBack | Customer feedbacks. |
2.2 Select all sales data in 2024
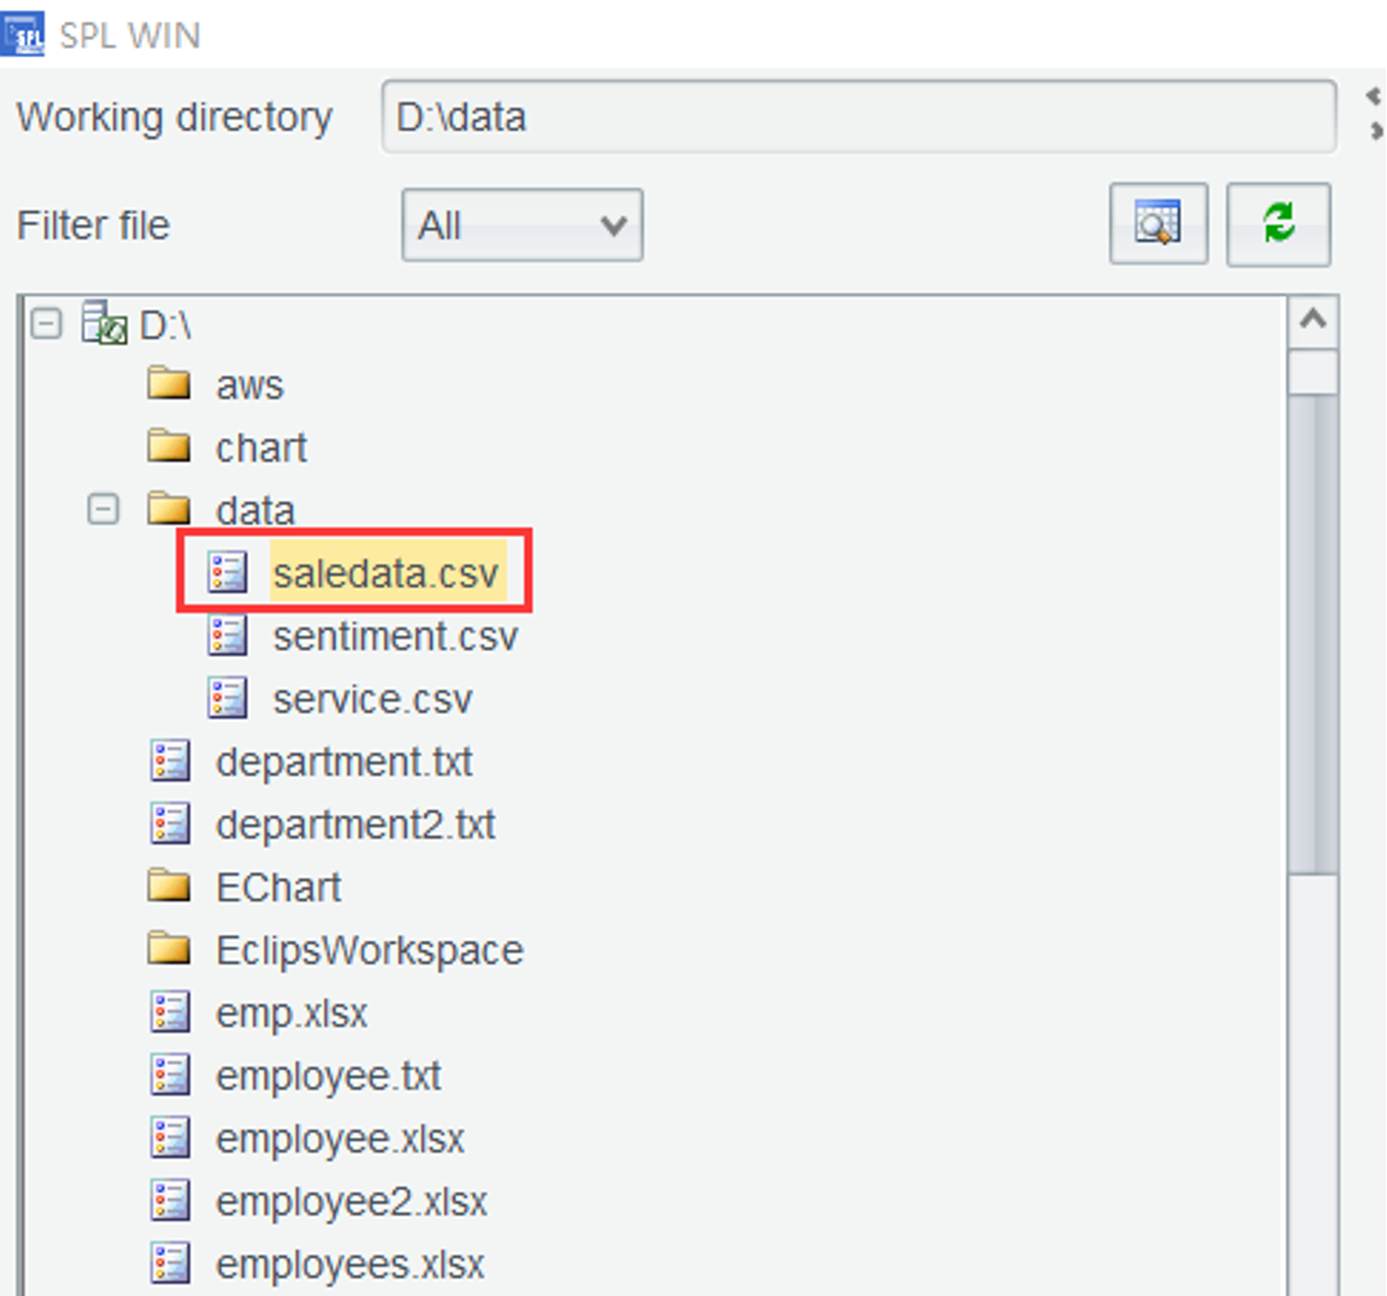
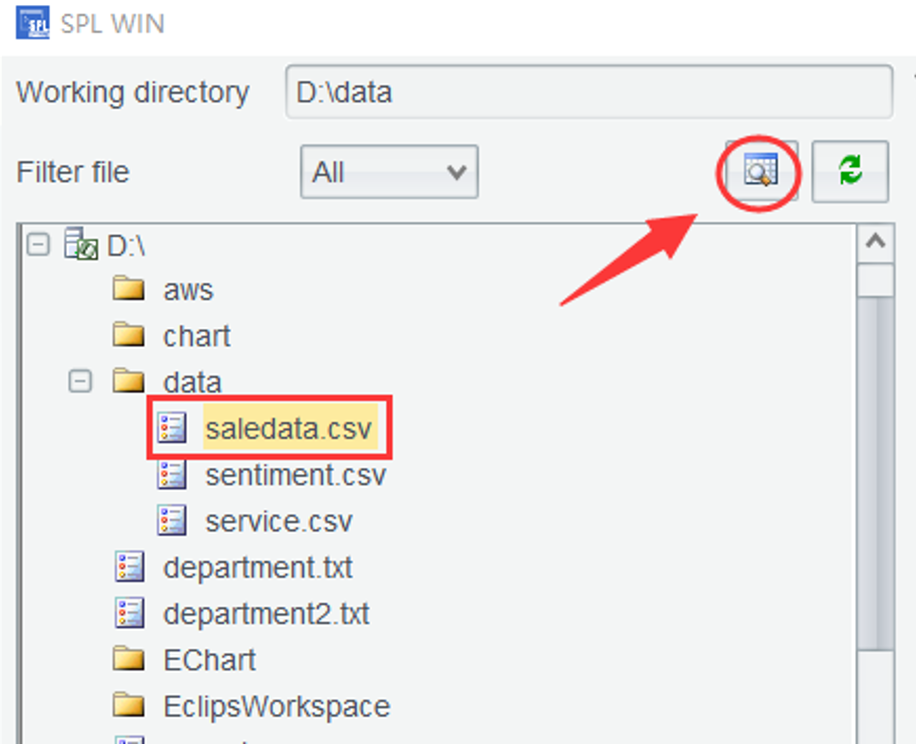
Step 1: Open saledata.csv.
Start SPL WIN, and in the data file list (as shown below), select saledata.csv:
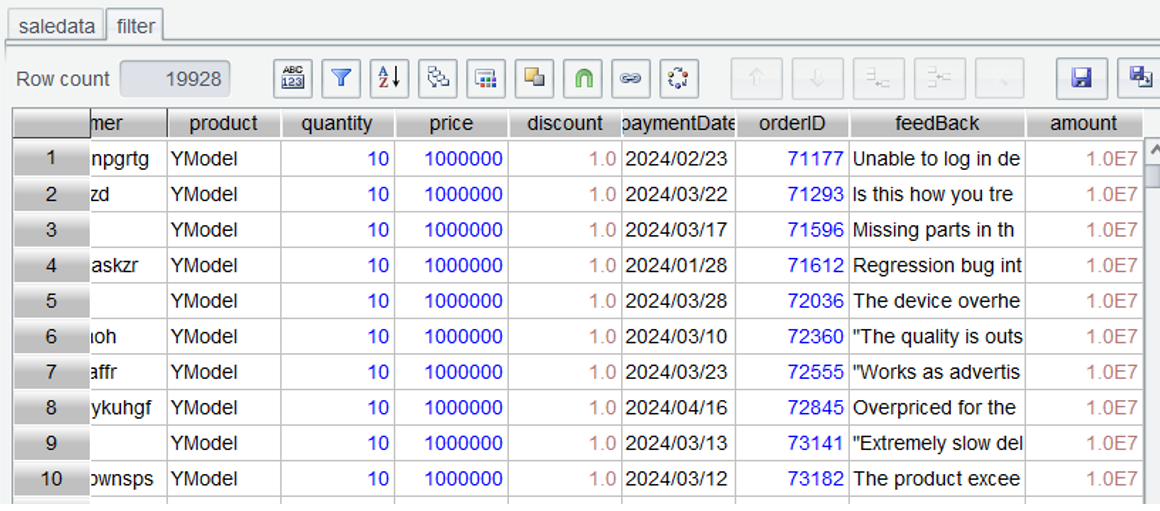
Double-click the selected file, a tab named saledata (red italics in this Practices highlight variables and function names that can be directly referenced in expressions) is added to the Content Zone and the total number of rows in the opened table is displayed on the top:
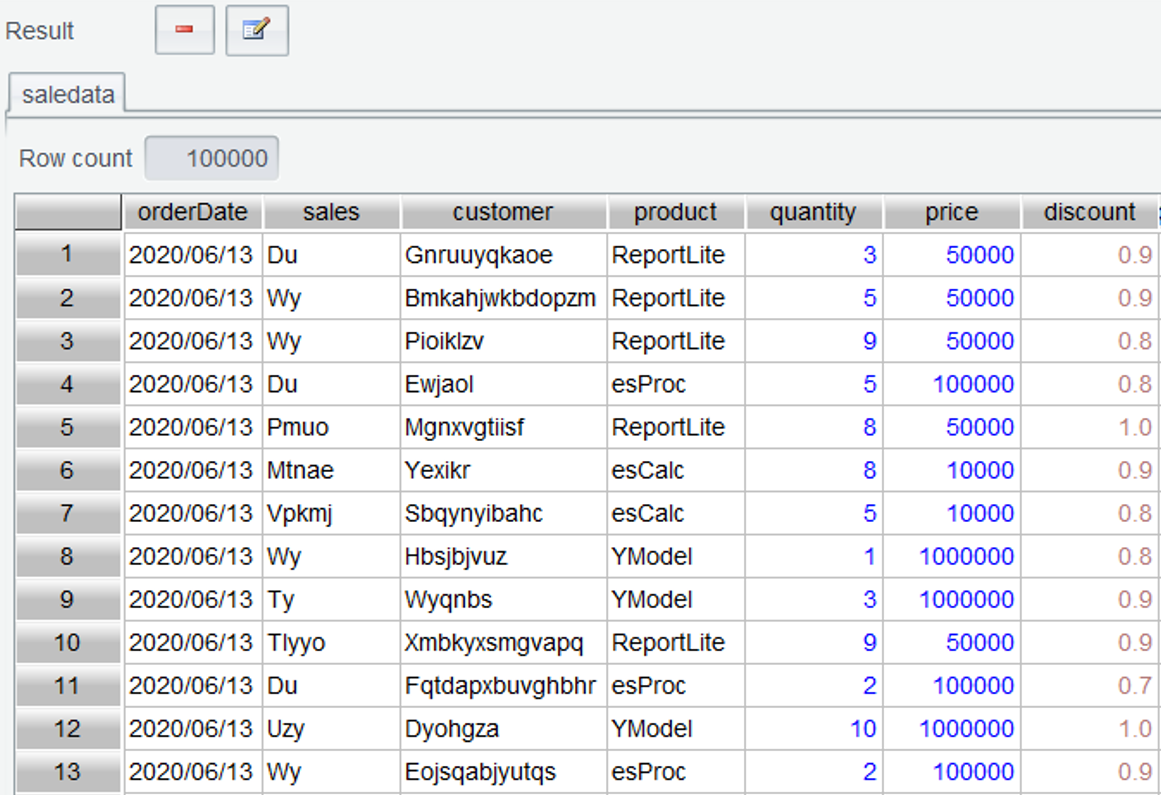
Different from the other columns on their left, quantity, price and discount are displayed in blue and red respectively. Data in these columns are numeric values. To differentiate different types of data, SPL WIN displays integers as blue and floating-point numbers as pink.
Learning point: In SPL WIN, a data table displayed on the Content Zone tab page is called table sequence. Unlike a database table, a table sequence has ordered data rows, which can be directly accessed according to their sequence numbers. For example, enter saledata(3) in the Edit Command Zone, execute it, and return the 3rd row of table saledata.
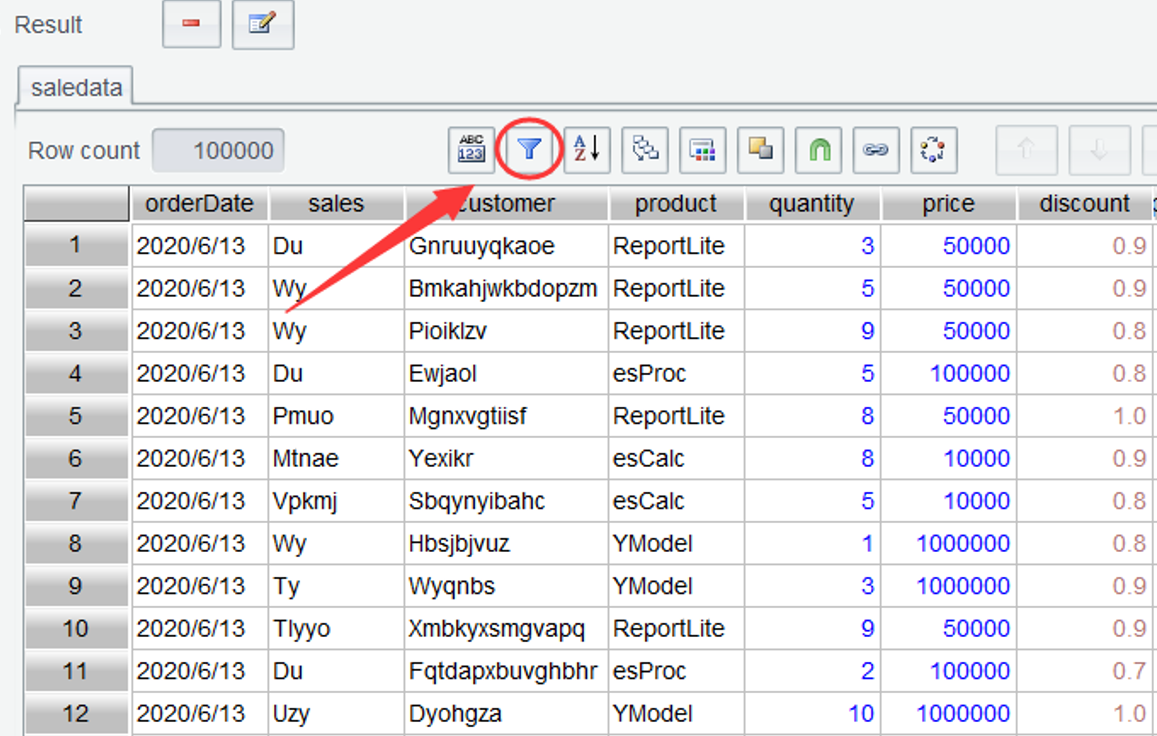
Step 2: To select sales data of the year 2024:
Click the “Filter” icon on the toolbar as shown below (the regular font in this book means values come from the interface, where they are control names or characters entered):
On the “Filter” dialog box popped up, enter expression year(orderDate)==2024 as the following shows, where year function gets the year part of the order date:
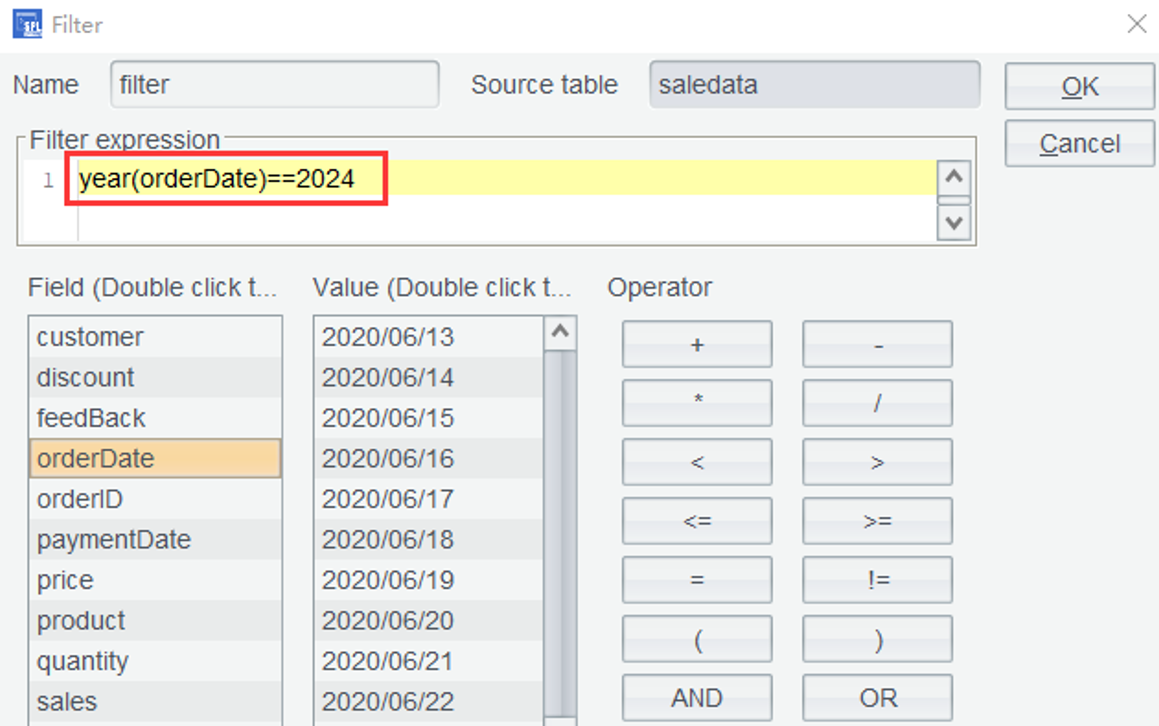
The interface recognizes filter as the default table name, which can be modified to one with business significance. But saledata on its right, the source table, cannot be renamed because the current computation is based on the table. Click OK to confirm the computation and the result is a new table named filter. If the table name is the same as the source table name, the computing result will overwrite the source table.
However, click OK and an error report appears:
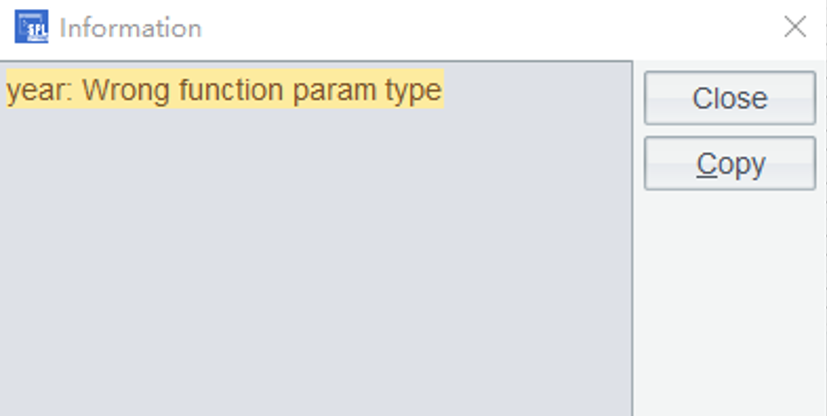
It reports a wrong parameter type. The table we directly opened should have been the date type orderDate, but as its format isn’t consistent with the corresponding configuration for application environment, the type is wrongly parsed and data is retrieved as string type.
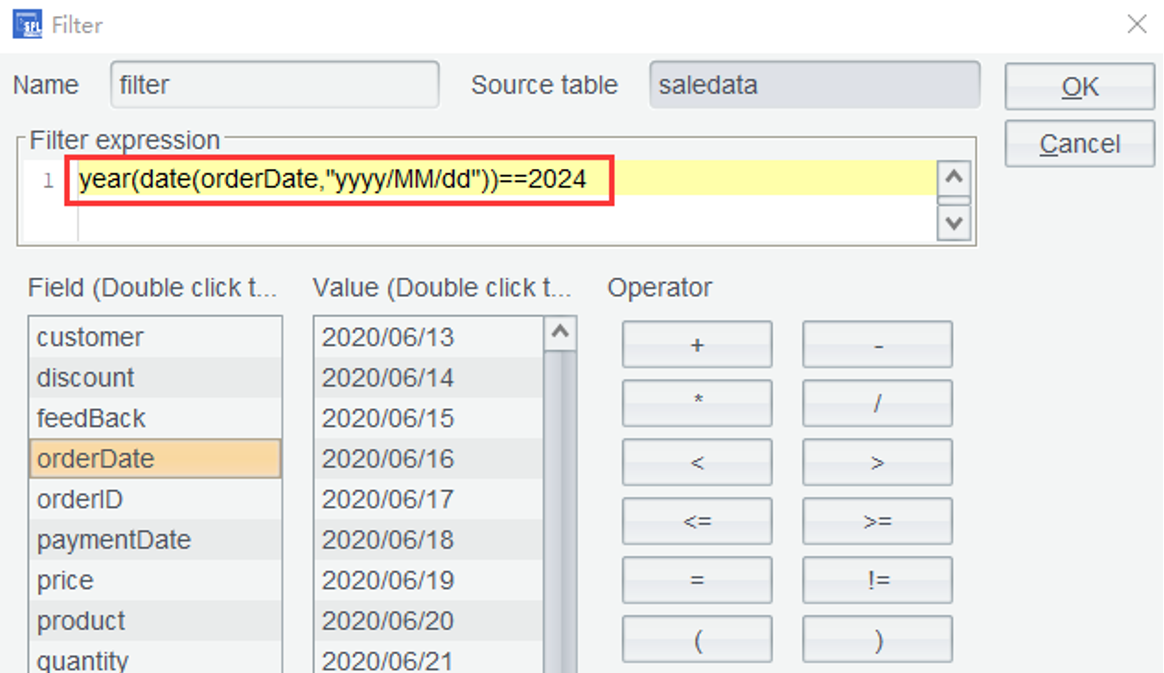
Solution 1: Modify the expression as year(date(orderDate,”yyyy/MM/dd”))==2024, where date function specifies the date format to transform orderDate to date type:
Learning point:
datefunction is used to transform a string, integer, or a long integer to date data. Learn more about the function HERE.
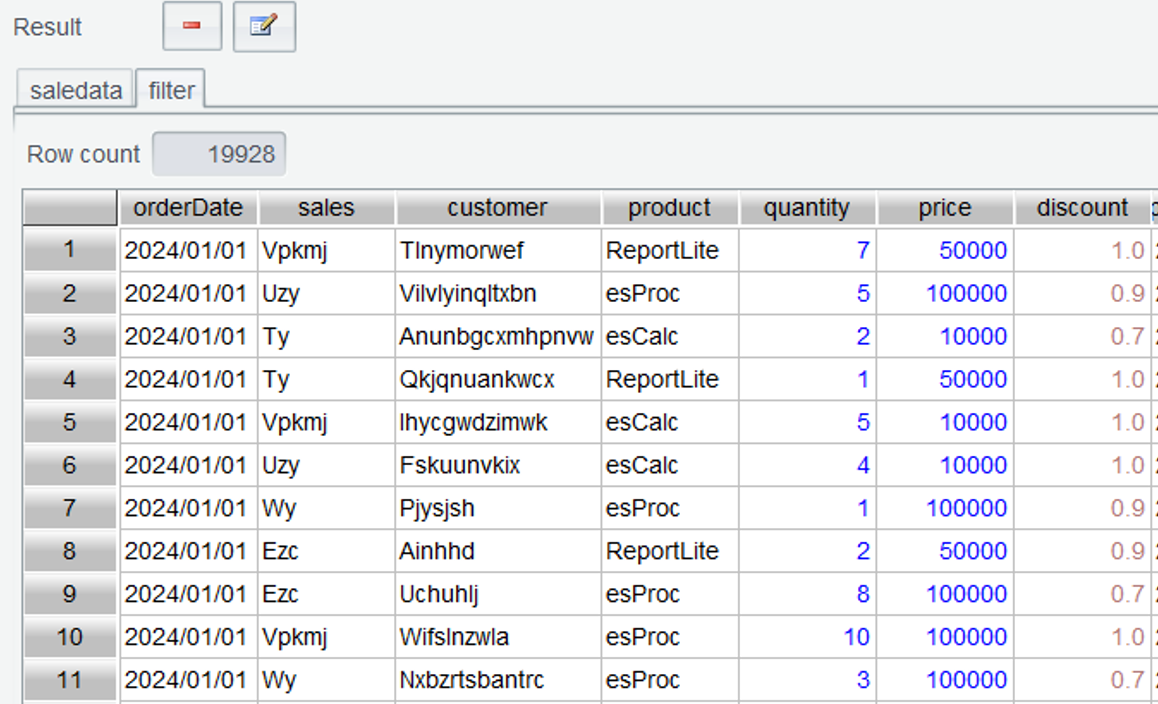
Click OK again and a filter table only containing order records of the year 2024 is generated:
Though we can use the date conversion function to transform a value to date type in real-time, it is still complicated when each computation needs a conversion operation.
Solution 2: Specify the target parsing format at the file opening. Thus, the data type conversion will be done before the subsequent computations, for which the conversion expression is no longer needed. To do this, select the file and click the “Browse” icon as the following shows:
In the opened file configuration interface shown below, set data type (Type) and parsing format (Format) for the order dates:
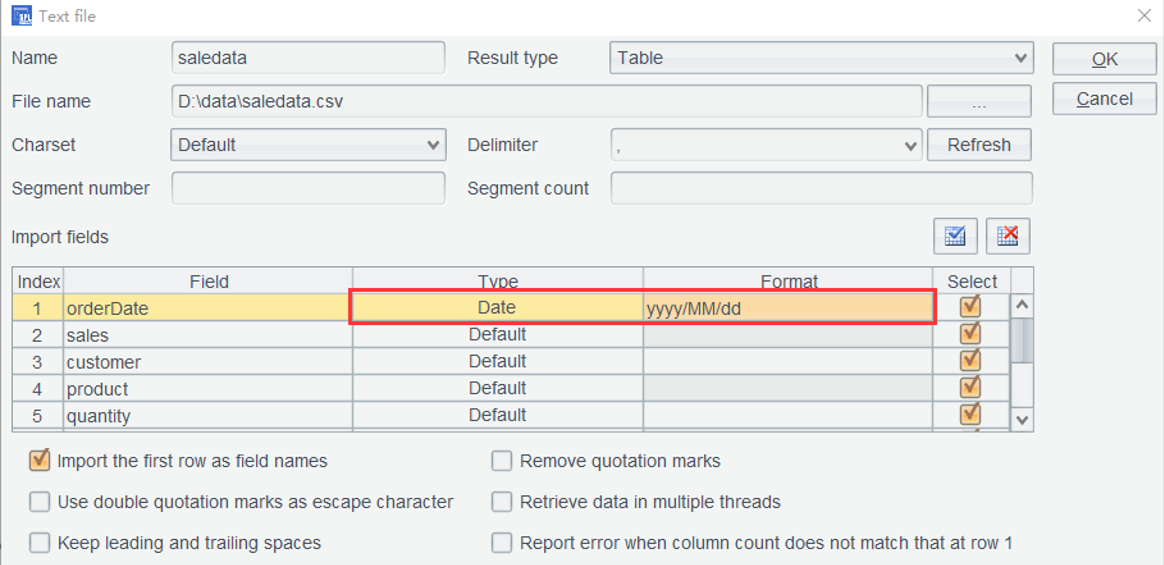
Click OK to open the generated file and the order dates are automatically transformed to date type. But this method still brings some hassles as most of the time, after all, the to-be-analyzed data has consistent date format and doing the configurations each time when a file is opened is a little complicated.
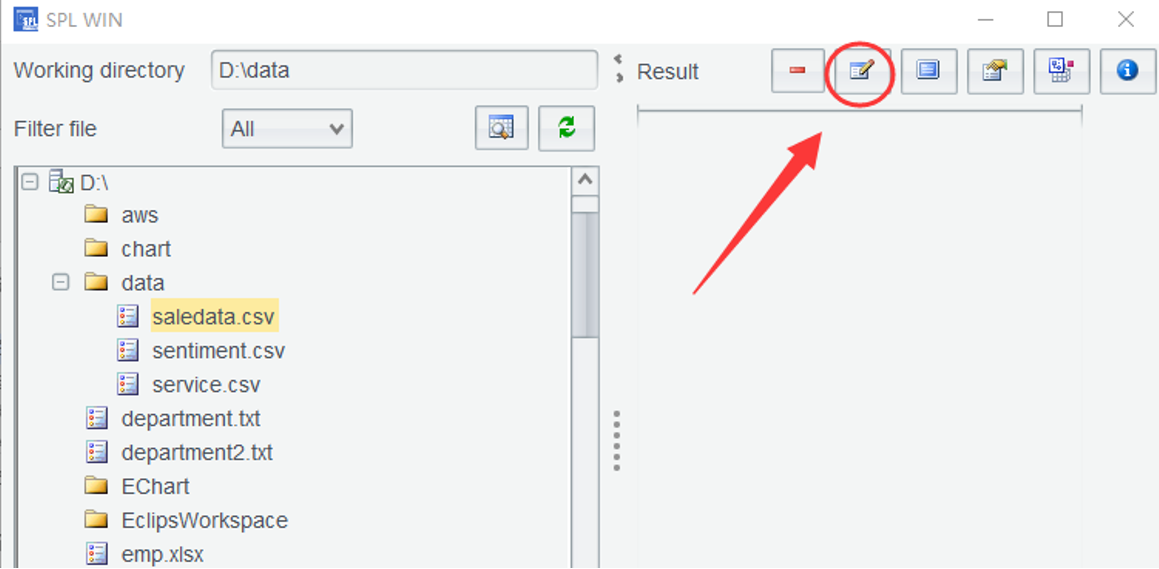
Solution 3: Click Options icon as shown below:
On the “Options” window, set date parsing format as yyyy/MM/dd according to date format in the current file:
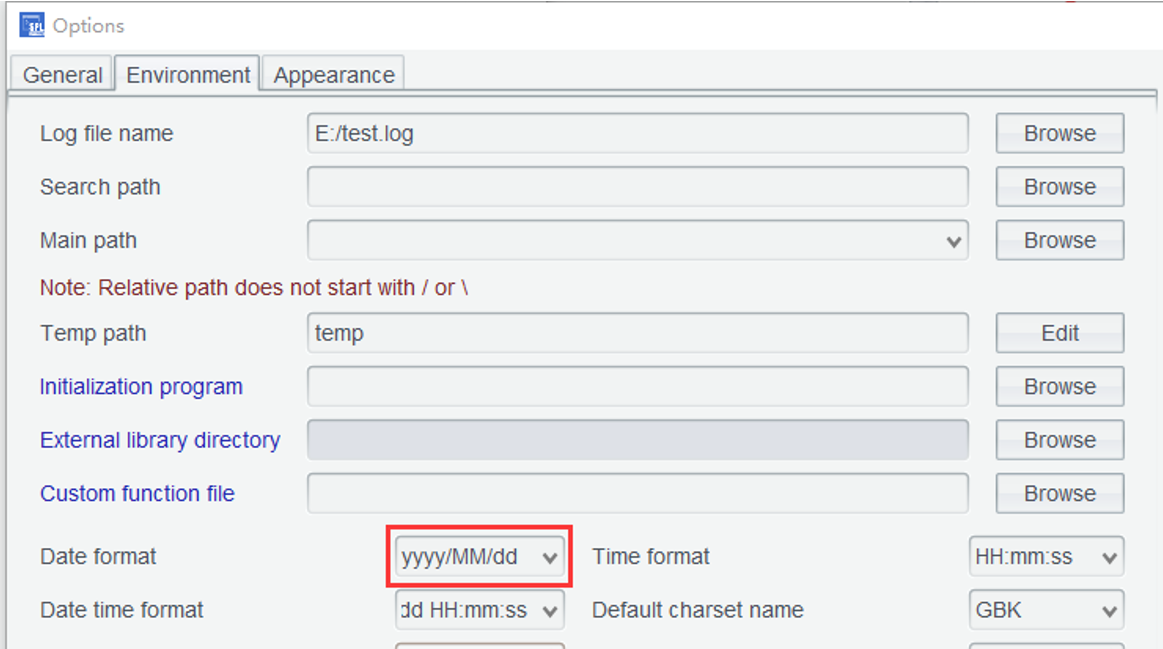
After the configuration is done, date values in every text file opened through double-click can be parsed as date type as long as their format is consistent with the corresponding configuration in the “Options” window. Note that, in the “Options” window, SPL WIN inherits the SPL configuration file in the current environment, so certain options are meaningless within SPL WIN and do not need to be taken care of in this book.
2.3 Select the top three large orders in terms of amount in 2024
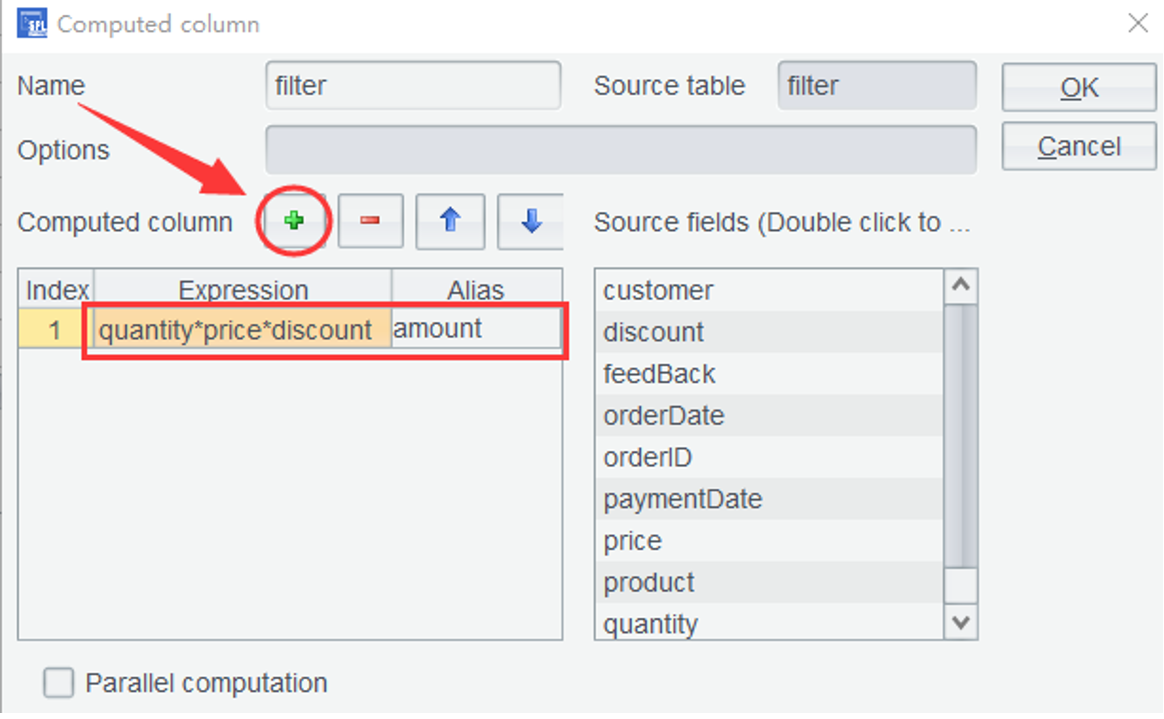
To do this we need to compute the order amount through a computed column – use formula quantity*price*discount as the computed column expression to get order amount amount.
Step 1: In Section 2.2, filter is the filtered data of the year 2024. On the “filter” tab, click Add Computed Column icon (as shown below):
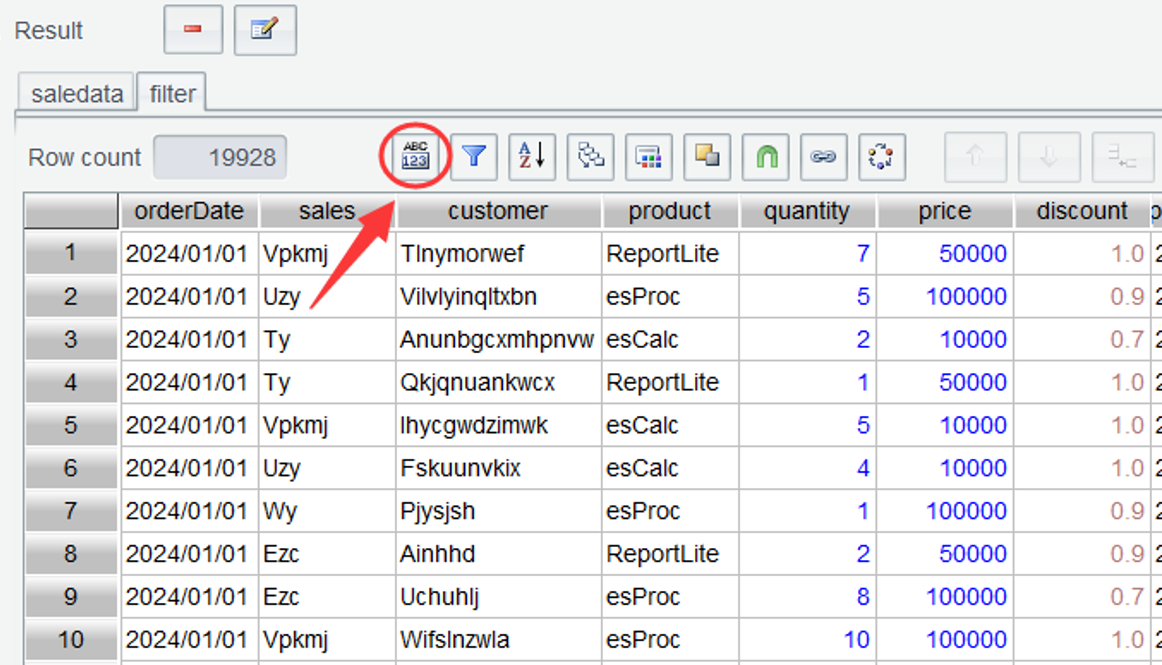
The “Computed column” dialog window pops up on the interface, where you click the Add icon (as shown below) and set expression and alias for the computed column in the newly added row (as the following shows):
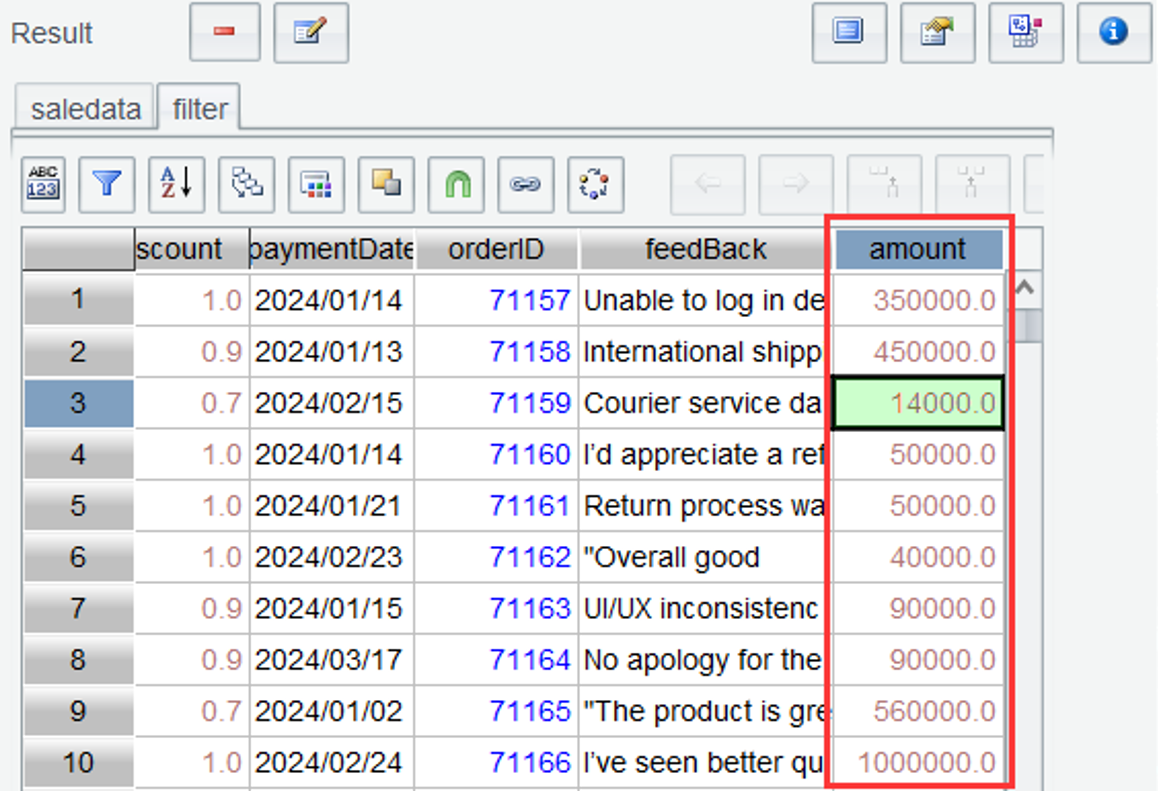
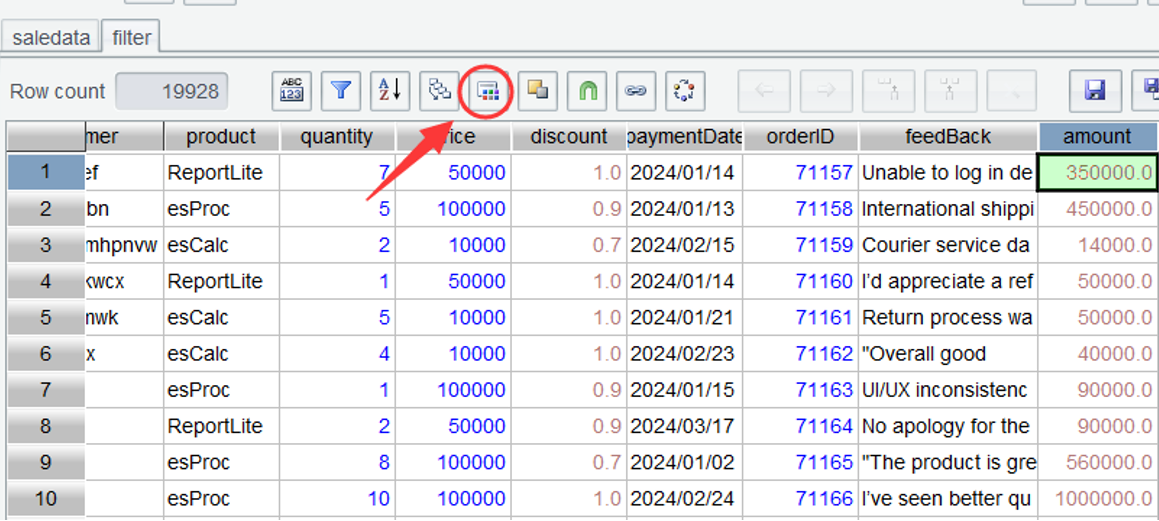
Click OK and a new column named amount is added at the end of table filter:
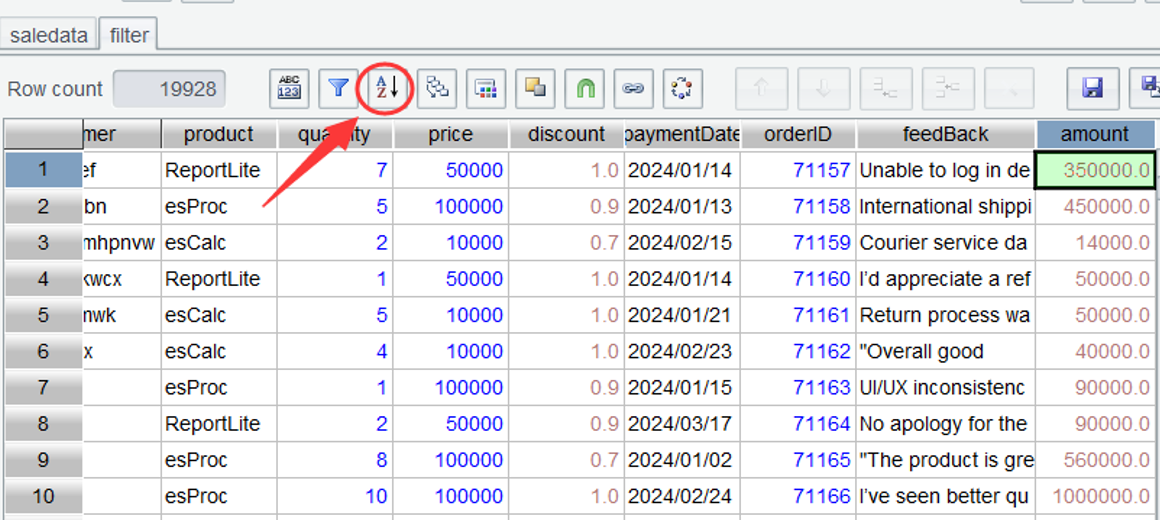
Step 2: After amount of each order is obtained, you just need to order rows by amount column and get the first three rows, which contain the three largest orders. Put cursor on amount column and click Sort icon:
On the popped up “Sort” window, ascending order by the current column is by default checked. Since rows need to be sorted in descending order, the checkbox is unchecked:
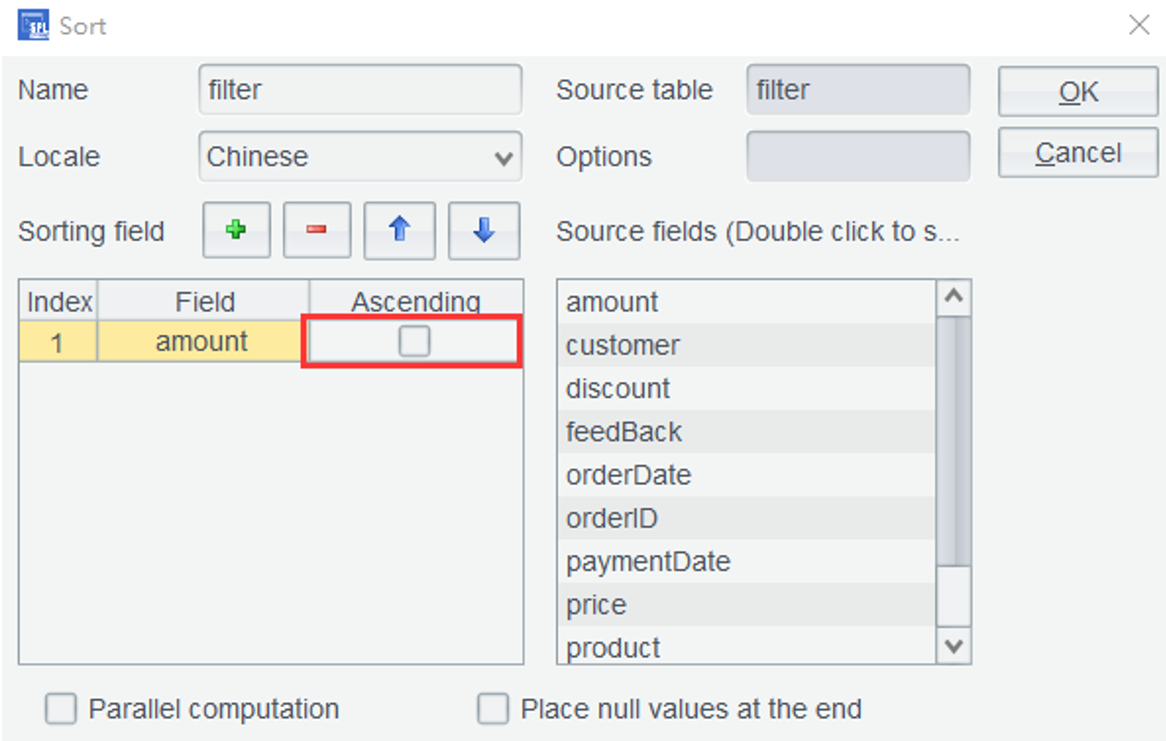
Click OK and we obtain a table sorted by amount in descending order:
Step 3: We can still obtain the first three orders in terms of amount through the “Filter” window. Click Filter icon and enter filter expression #<=3:
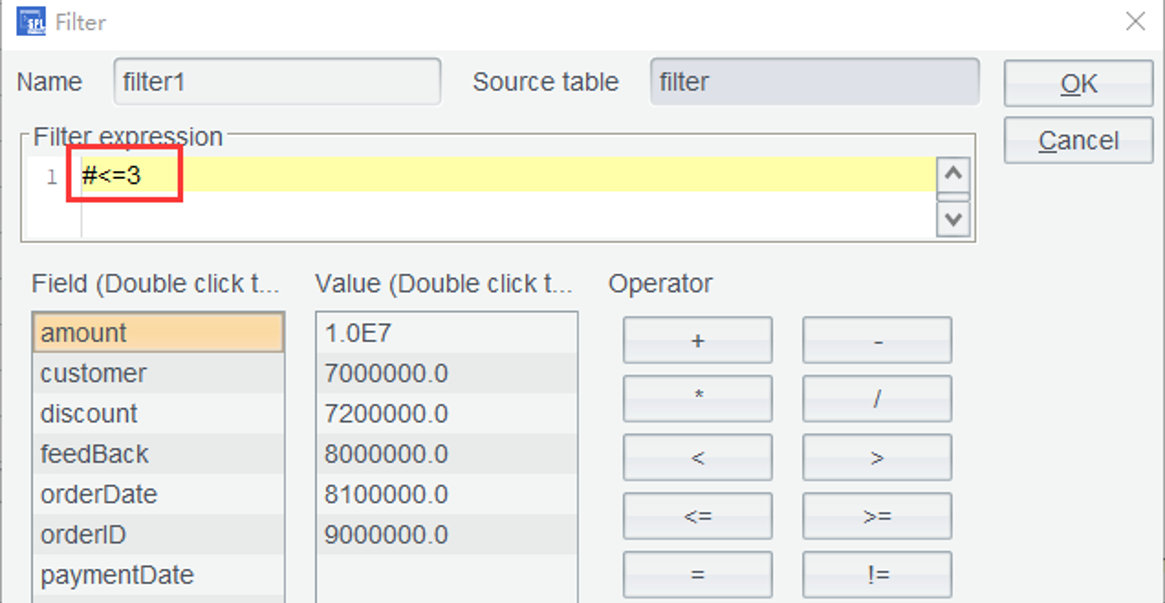
Click OK and we get records of the top three large orders:
Learning point: In a table sequence, row numbers begin from sequence number 1. In an expression, symbol
#is used to reference the sequence number of each record.
2.4 Compute total sales amount, the largest single order amount, and the order count
In Section 2.3’s filter table, amount of each order (amount ) is already obtained. Click filter table on the Content Zone.
Solution 1: Perform grouping and aggregation on filter table. Place cursor in the amount column and click Group icon:
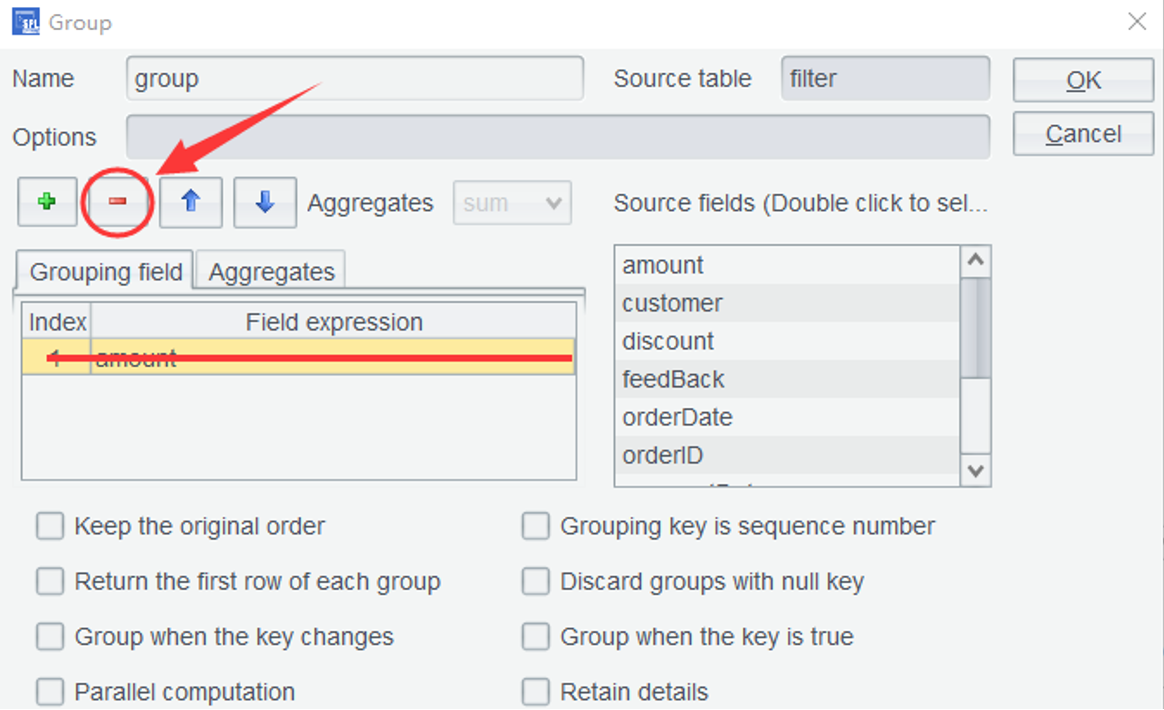
In the pop-up “Group” window, amount is automatically added under the grouping field, making it convenient for performing most grouping operations. Since we just need to compute the total sales amount and the largest order amount, there is no need to specify the grouping expression. In this case, take the whole filter table as a set of data and click Minus icon to remove the current grouping field expression:
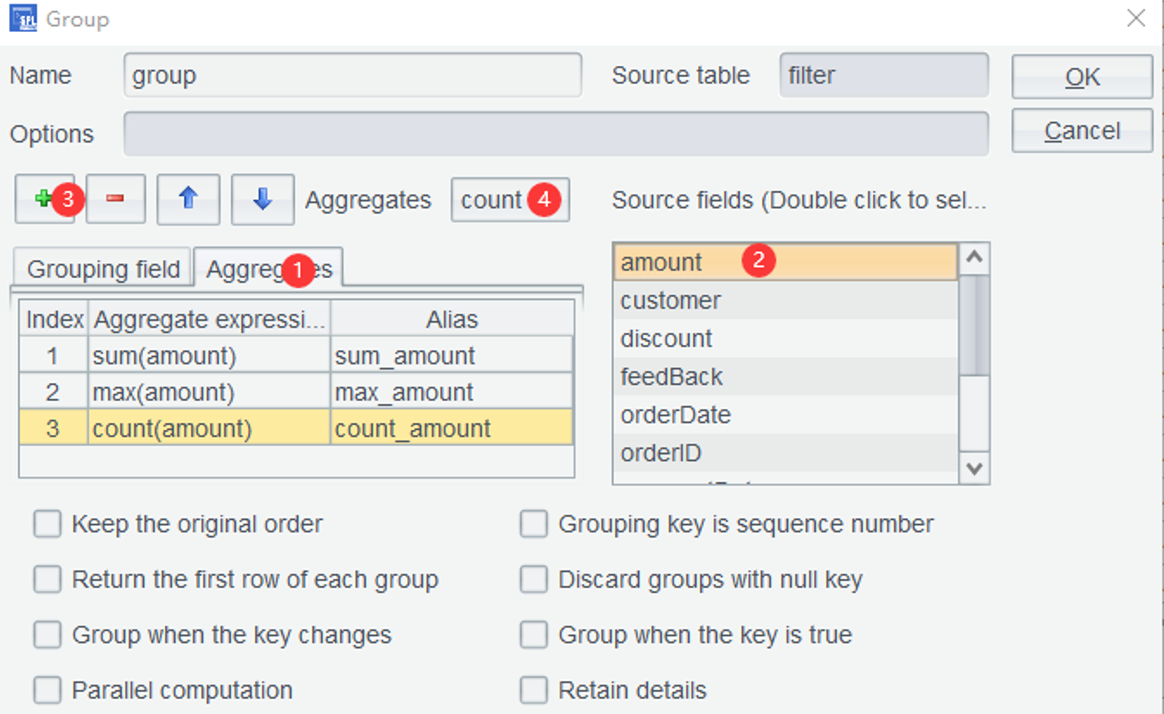
Then click “Aggregates” tab (①), select amount under “Source fields” (②), click “Add” icon to add a row of aggregate expression(③), select the corresponding function for the current aggregate expression (④), and repeat operation 3 and operation 4 to finish editing expressions for computing total sales amount, the largest order amount and the order count, as the following screenshot shows:
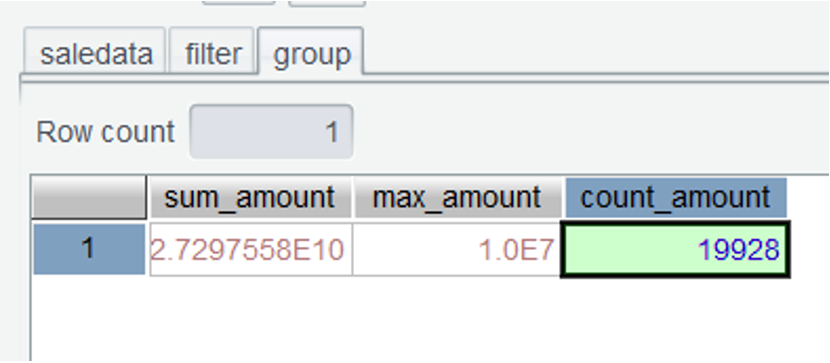
Click OK and get the expected results:
With grouped data, on most occasions, it is a certain type of index value in each group that we are interested in. Once the index values are obtained, the detail records in each group are discarded. On the surface, those detail records are aggregated into one single value, and that’s where the name “aggregate value” derives from. SPL WIN supports all commonly seen aggregate operations, including computing sum value (sum), count operation (count), finding the maximum value (max), finding the maximum value (min), computing the average value (avg), and counting distinct values (icount).
Learning point: The SPL WIN aggregate functions also include top(), which returns one or more values according to the specified requirement. Find its uses HERE.
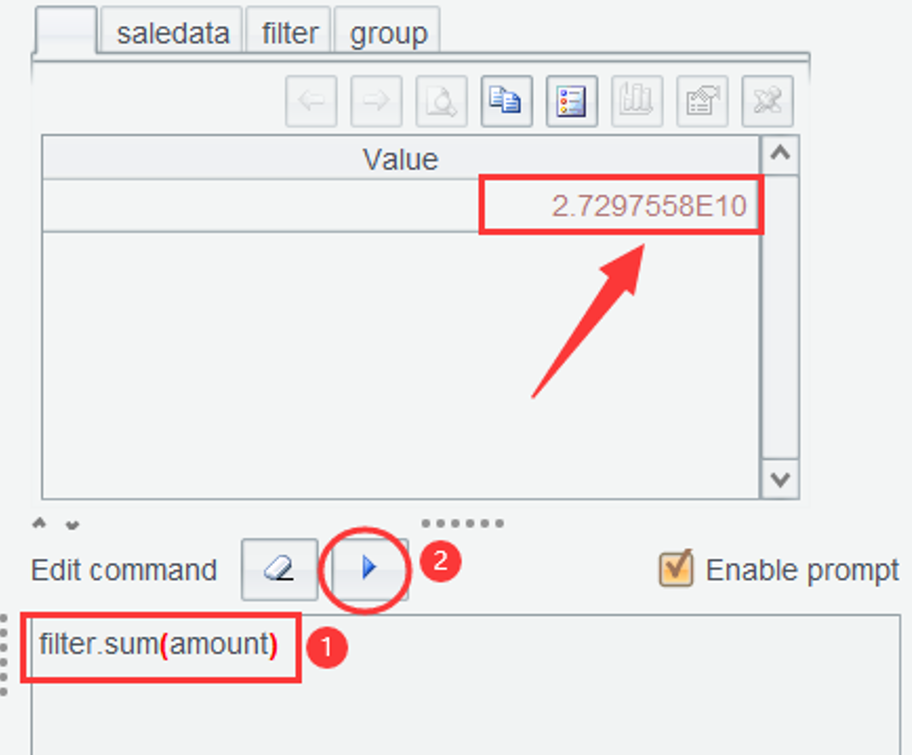
Solution 2: Instead of using the interface-based grouping, it is more convenient to execute an expression defined in the Edit Command Zone to deal with the same scenario and computing goal. According to the directions shown in the following screenshot, enter filter.sum(amount) to compute the total sales and click Execute button to obtain the total sales amount:
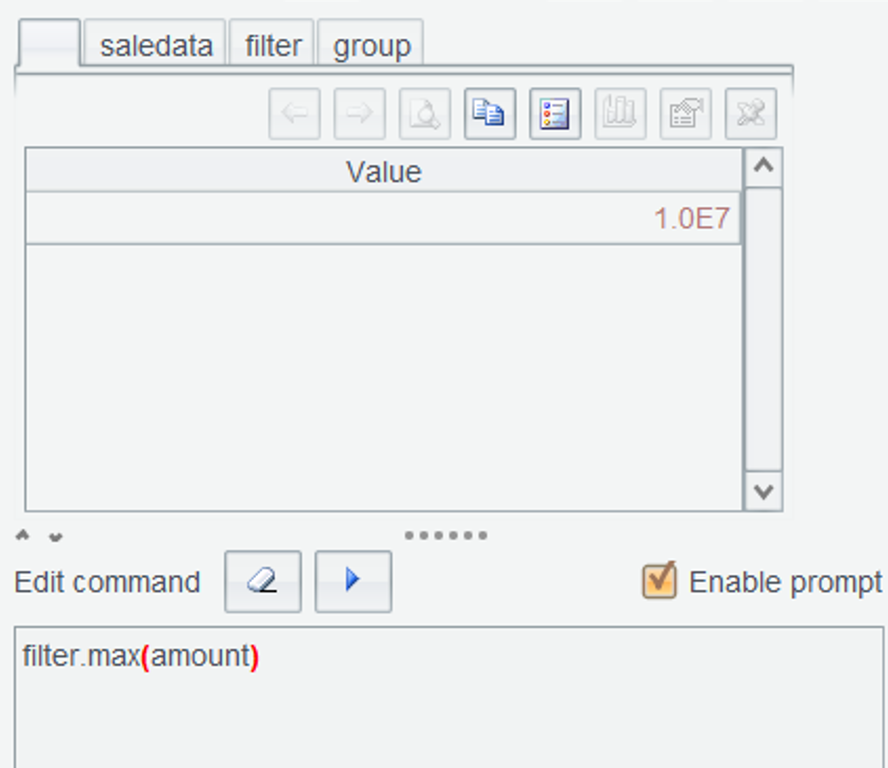
Similarly, we can obtain the largest order amount:
The number of orders is equivalent to the record count in filter table, which is already obtained.
2.5 Get the first and the last paid orders in 2024
It is natural to think that as long as we sort records by paymentDate (paymentDate ), we can get the first and the last paid orders. However, the sorting method is not actually the most suitable solution. When the data volume is small, this method might barely work. But when the data volume is very large, the sorting process becomes highly time-consuming, making this approach far from even acceptable.
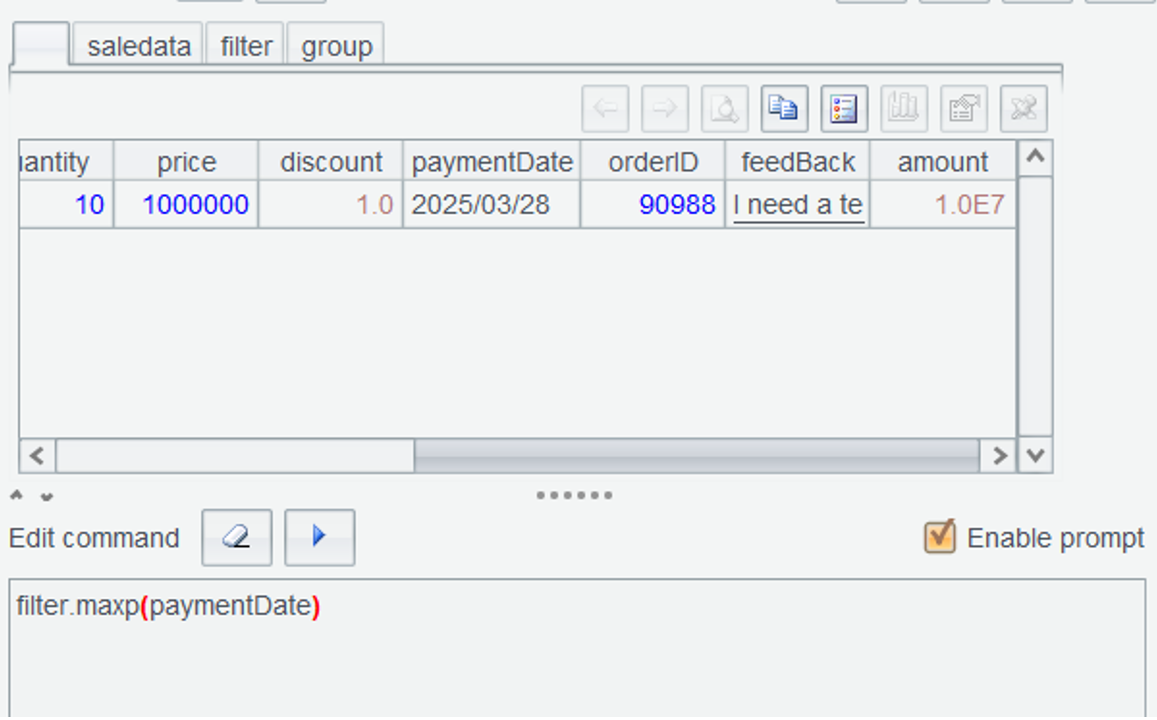
SPL provides location function maxp() to quickly find the last paid order, greatly increasing the computing efficieny.
In the Edit Command Zone, execute expression filter.maxp(paymentDate) and click Execute button:
It is convenient to get the last paid order using maxp() function. Similarly, we can use maxp() function to get the first paid order.
By default, maxp() function returns one eligible data row containing the last paid order. Actually, there are more orders paid at the same time in the table. To get all the eligible data rows, a function option is needed. Execute filter.maxp@a(paymentDate) in Edit Command Zone to get all last paid orders:
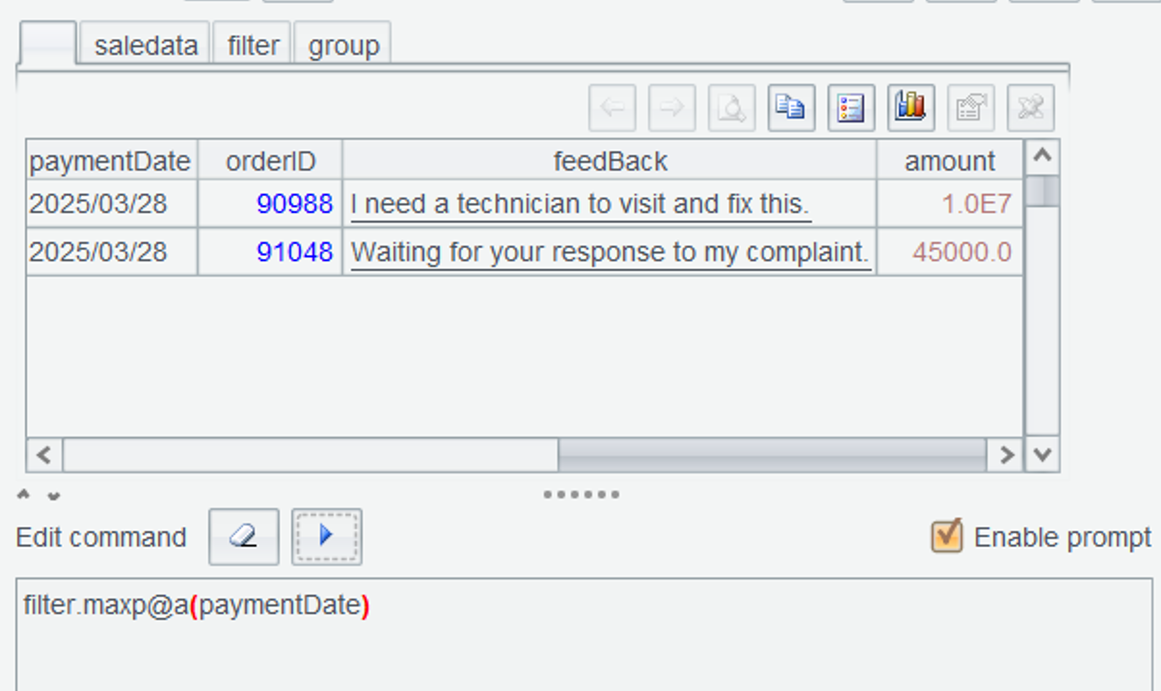
Learning point: SPL function syntax enables a function to perform multiple operations. A function option needs to be headed by joint symbol
@after the function name. In this example,maxp@a()returns all data rows meeting the specified condition. Find uses of maxp() HERE.
Though maxp() function can get data rows containing the largest value, there are many other commonly seen scenarios in the real-world where the computing goals are more than getting the largest one. They may also aim the second largest one and more ranked later. Take grade ranking as an example, usually students ranked top3 will get awards. maxp() function is unable to obtain the topN items. Instead, top() function explained in Section 2.4 is the appropriate choice. This function can return a data row of any ranking.
2.6 Respectively count customers who placed orders and those who have paid (distinct) after 2025-05-01
Solution 1: Through visual steps in the interface, perform filtering to obtain rows after the specified time and then group records by customers and perform the aggregations.
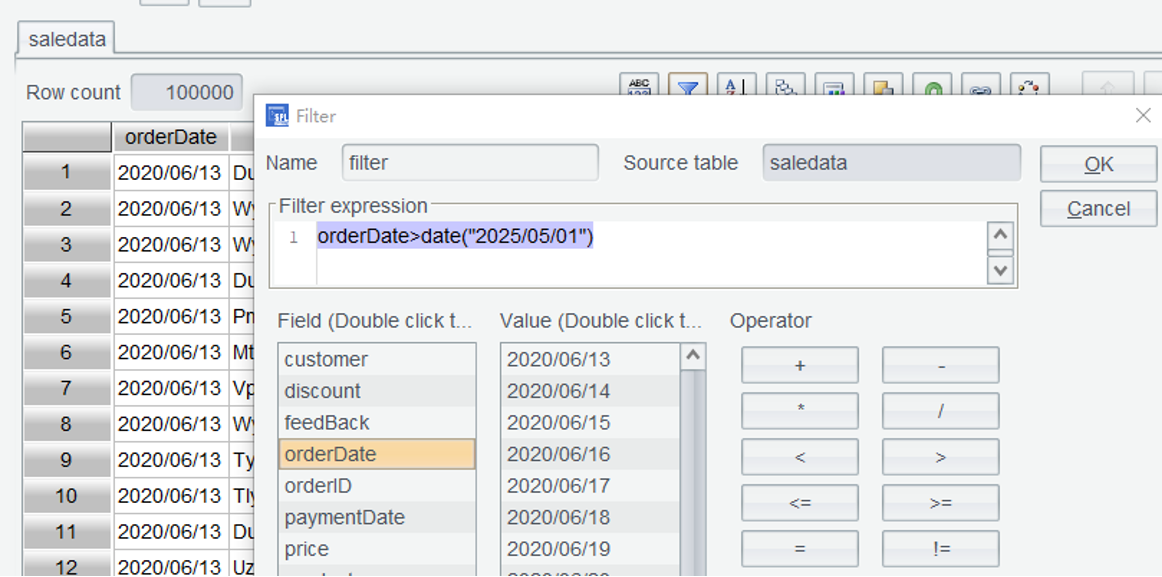
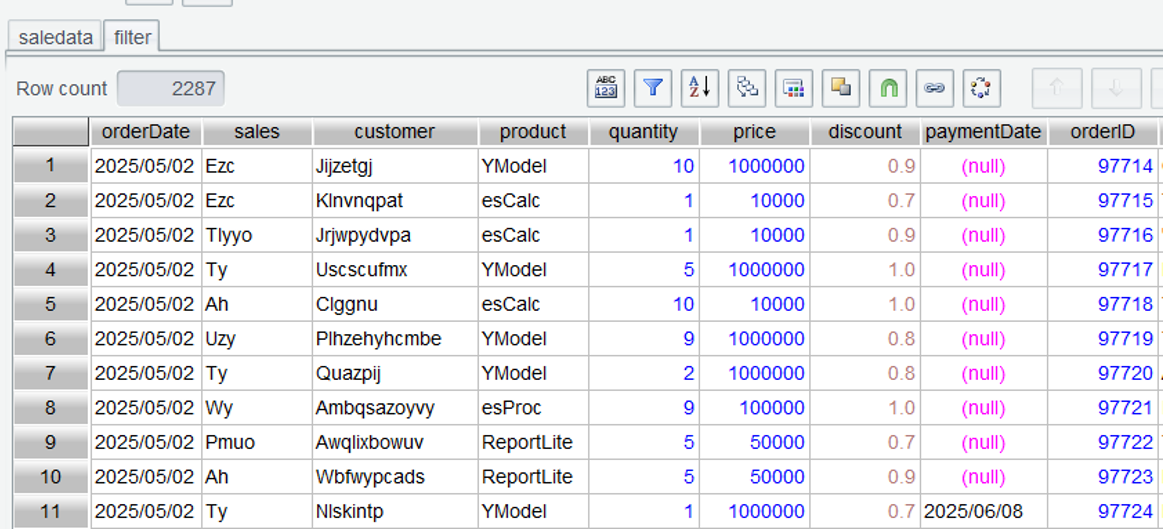
Step 1: Select saledata table and use filter expression orderDate>date("2025/05/01") to select data rows after 2025-01-01:
Click OK and we get filter, the filtered table:
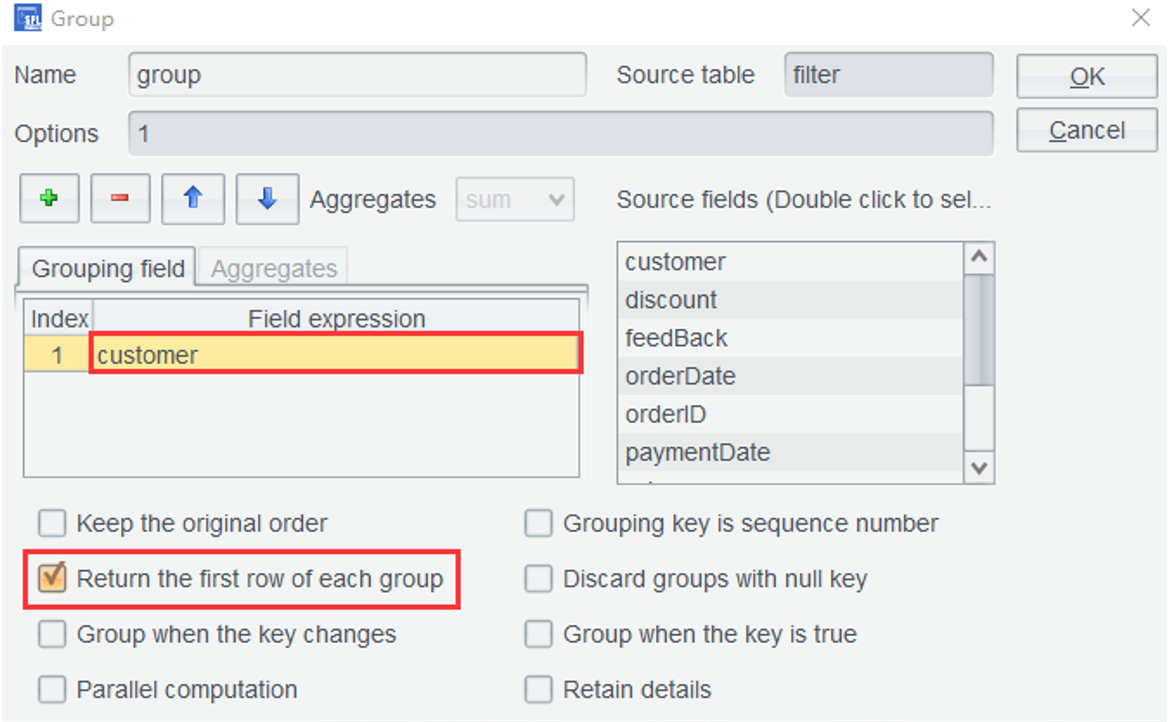
Step 2: Group records by grouping field customer . No need to set the aggregate expression because the intra-group aggregation isn’t what we care about. Yet one data row should be retained for each group. To do this, select Return the first row of each group:
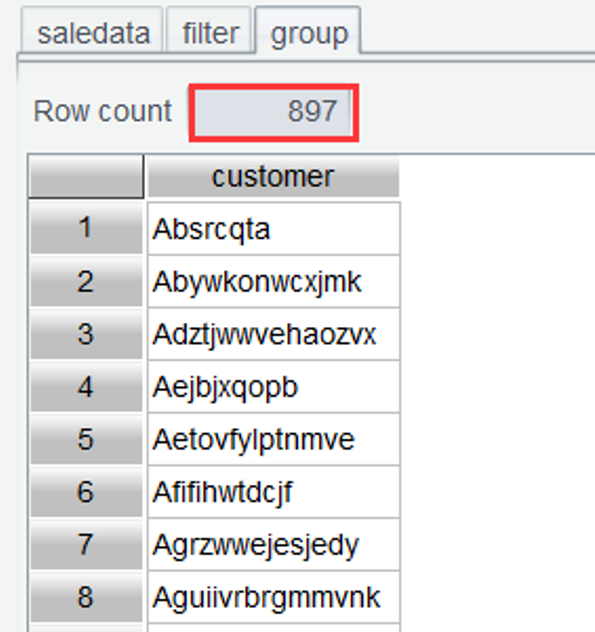
Click OK and the customer count is computed, which is 897:
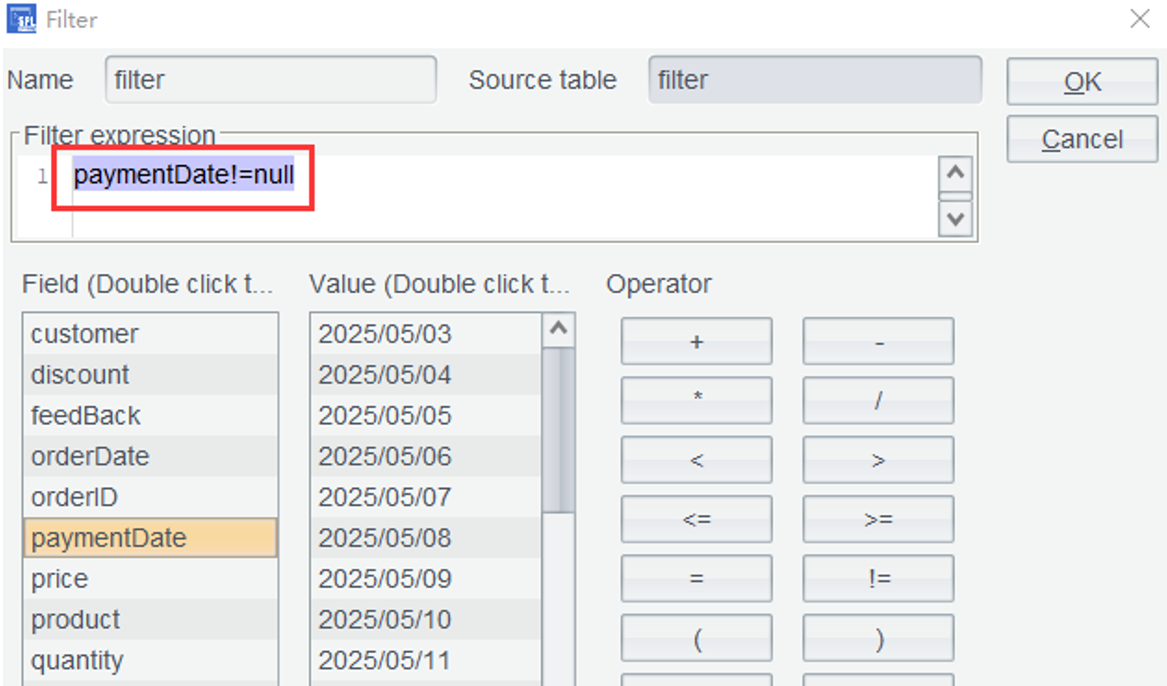
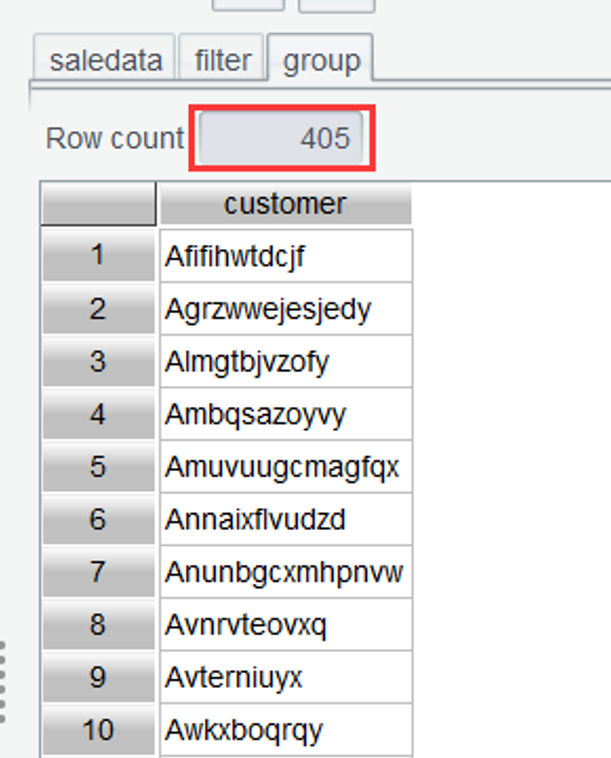
Step 3: In order to count customers who have paid, we need to go on to select data rows where the orders are paid (paymentDate!=null) from the filter table:
After the second filtering, group records also by customer and compute the number of customers who have paid, which is 405:
Solution 2: Using a grouping method just to deduplicate group names and then perform aggregation is a bit of overkill for what is essentially a grouping computation. This is similar to the role maxp() function plays in Section 2.4. There is id() function for performing distinct directly. Enter filter.id(customer).count() in the Edit Command Zone and execute the statement to get the customer count:
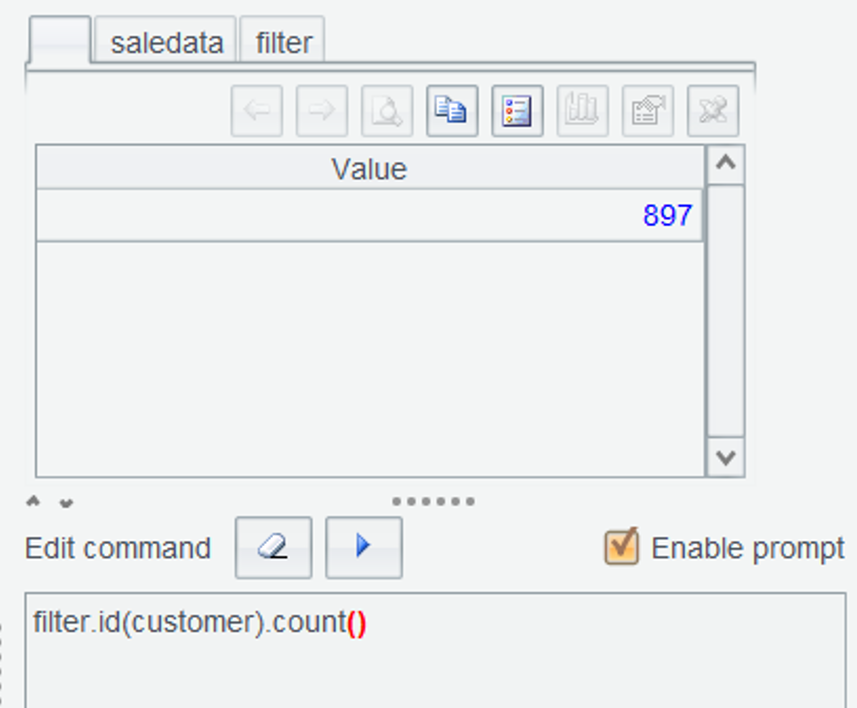
Learning point:
id()function gets distinct values from a table sequence. Find parameters and options it works with HERE.
SPL Official Website 👉 https://www.esproc.com
SPL Feedback and Help 👉 https://www.reddit.com/r/esProcSPL
SPL Learning Material 👉 https://c.esproc.com
SPL Source Code and Package 👉 https://github.com/SPLWare/esProc
Discord 👉 https://discord.gg/sxd59A8F2W
Youtube 👉 https://www.youtube.com/@esProc_SPL

