

7. Text processing
7.1 Data information
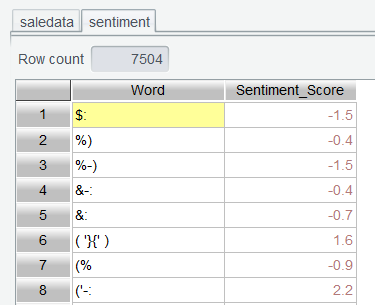
Sentiment dictionary ( sentiment.csv ):
| Field | Description |
|---|---|
| Word | Words |
| Sentiment_Score | Sentiment score. Rate positive sentiment words +5 at most and negative sentiment words -5 at most. |
7.2 Find the high-frequency words in customer feedbacks
Step 1: Retrieve data. Use Browse functionality to retrieve the two columns to be used in the analysis from saledata.csv :
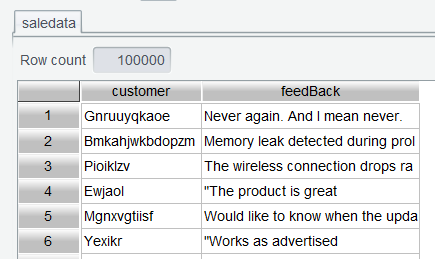
Normalize words in the feedbacks by changing all characters to lowercase and removing white spaces at both ends of each word.
Solution 1: Append a computed column to saledata table to normalize contents of feedBack and store them in a new column. The approach will result in redundant data and higher memory space usage.
Solution 2: SPL WIN has run() function that directly computes an expression on each row of data in a table sequence. In Edit Command Zone, execute expression saledata.run(trim(lower(feedBack)):feedBack):
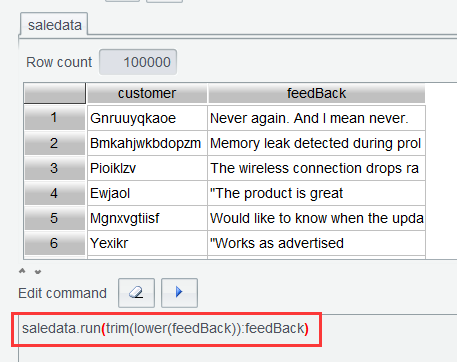
There is also an assignment-based way to write the above expression:
saledata.run(feedBack=trim(lower(feedBack)))
The two are equal. Execute the expression and get the normalized feedbacks:
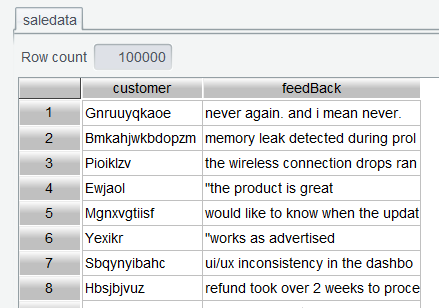
In the expression, trim() function removes white spaces at both ends of each character; lower() function converts strings to lowercase.
Learning point : The table sequence’s run() function loops through each row of a table, computes the specified expression on each data row in order, and assign result to the specified column. Find detailed uses HERE.
Step 2: Convert feedbacks to sequences of words and again execute an expression in Edit Command Zone:
saledata.run(feedBack.words():feedBack)
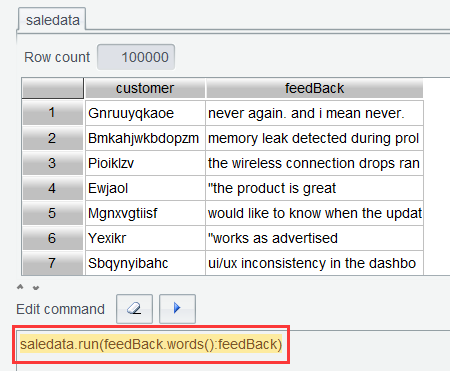
In the expression, feedBack.words() converts each feedBack value to a sequence of words. By executing the two expressions using two steps, we want to highlight the result of executing the function in each step. When you become a skilled SPL WIN user, you can combine them into one expression and execute it in one step, which is saledata.run(trim(lower(feedBack)).words():feedBack), for example.
Now each feedBack value is a sequence of words:
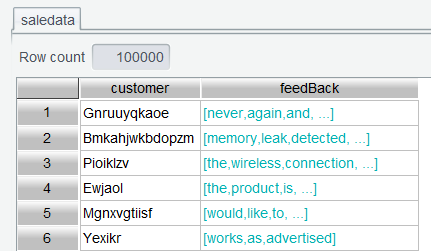
Double-click a feedBack value in any rows to view details:
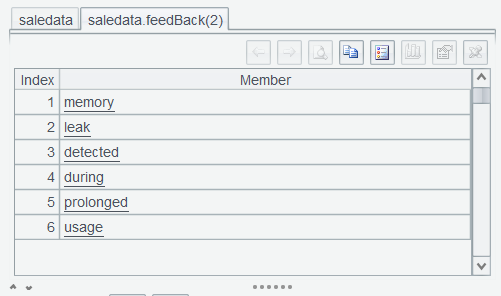
Note that the result is a sequence. Unlike the table sequence, for which a toolbar is created, sequences do not support interface-based operations.
Learning point : In SPL WIN, an ordered set made up of multiple data items is called a sequence . With a sequence, there aren’t icons for data analysis in Content Zone, and the table header is displayed as “Member”. A table sequence is a subset of the sequence.
Step 3: In saledata table, concatenate details to combine all feedbacks as AllWords :
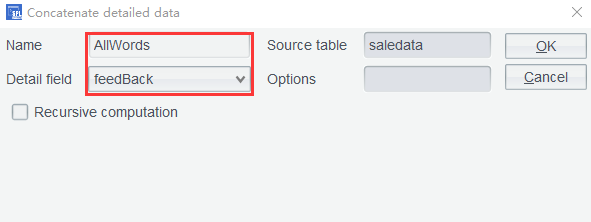
AllWords consists of a sequence of all words:
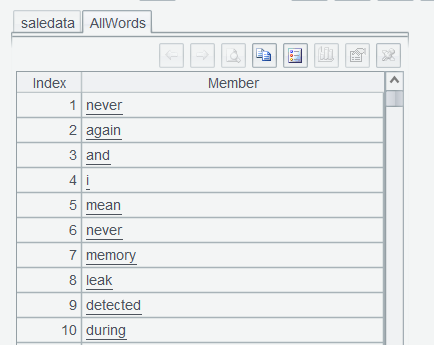
Group members by word to find the number of their appearances. Since AllWords isn’t a table sequence, the icon for grouping operation on the interface is disabled. But you can still edit an expression in Edit Command Zone – AllWords.groups(~:value;count(1):Count) to directly group sequence AllWords :
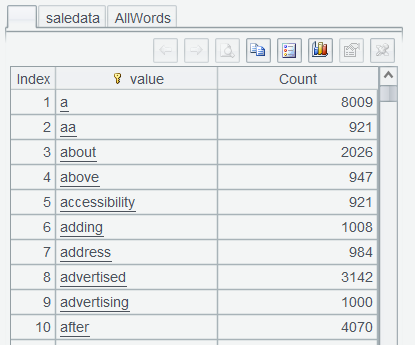
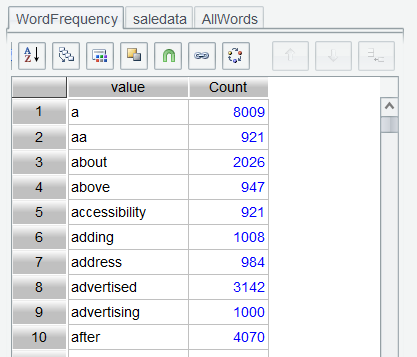
An unnamed result set is returned from the Edit Command Zone. For convenience of later computations, it is named WordFrequency :
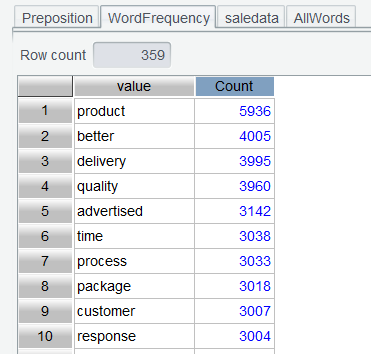
Click Sort icon on the interface or double-click Count column to sort Count values in descending order and find the most frequently appearing word:
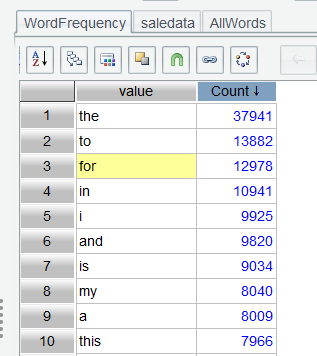
Seen from the sorted WordFrequency table, there are a lot of business insignificant words, such as prepositions, conjunctions, and the definite article, that appear very frequently. And they need to be removed.
Step 4: Discard those meaningless words.
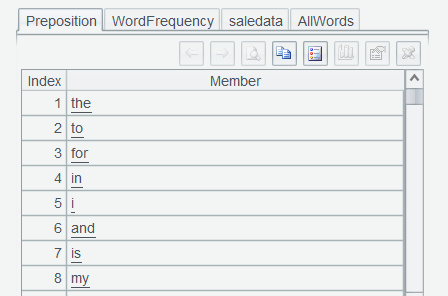
List prepositions and execute an expression in Edit Command Zone:
"the,to,for,in,i,and,is,my,a,this,was,than,as,after,no,you,would,s,by,never,of,with,up,me,during,it,t,be,on,will,even,please,d,v,or,your".words():
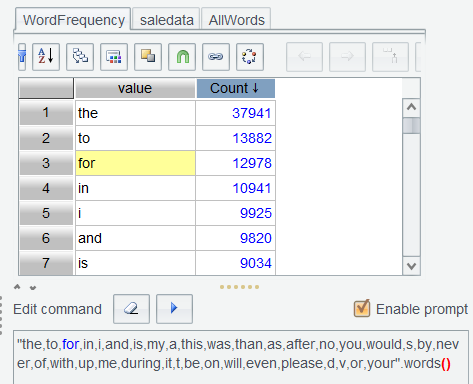
Execute the command and name the result set Preposition :
Click Filter icon to perform filtering on WordFrequency . Then type in filter expression !Preposition.contain(value):
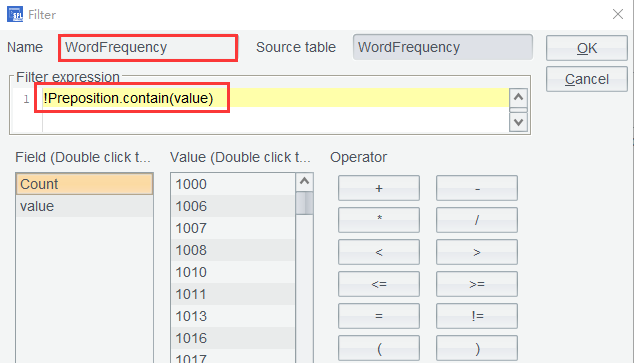
Click OK to obtain a clearer result set, which highlights the core aspects – product, quality, service and delivery – in which customers take interest. Enterprises thus can use the data to precisely identify the most frequently discussed business dimensions.
7.3 Analyzing customer satisfaction with products
Sentiment analysis helps to find whether or not customers are satisfied with the product they bought. Here is a simple dictionary-based method.
Step 1: Retrieve customer names and feedbacks from the sales data, and transform the feedbacks to sequences of words. The sales data is the same as the that in the preceding example:
Step 2: Open sentiment.csv and retrieve the sentiment dictionary:
Step 3: Create association between the sentiment dictionary and the sequence of sequences of feedback words to compute the average sentiment score. Add a computed column in saledata table using a computing expression:sentiment.align@b(feedBack:~,Word).avg(ifn(~.Sentiment_Score,0))
Computed column settings:
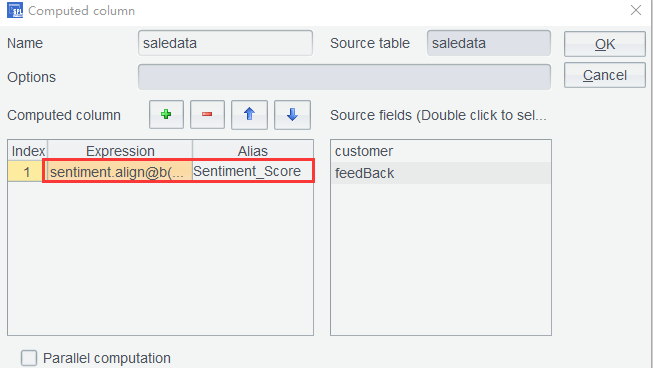
In the above expression, sentiment.align@b(feedBack:~,Word) joins sentiment table and feedBack column through the equality of the current feedBack member and the corresponding sentiment.Word field value. avg(ifn(~.Sentiment_Score,0)) computes average score on the joining result members; ifn(~.Sentiment_Score,0) returns 0 if ~.Sentiment_Score is null as some words are not included in the dictionary.
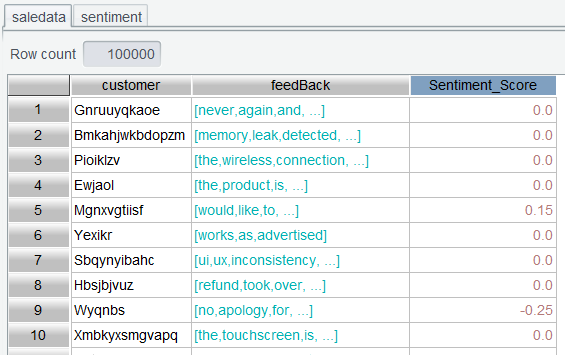
Click OK and get the result set:
Step 4: Rank customers’ sentiment scores. Add a computed column through expression if(Sentiment_Score>0.2:"positive",Sentiment_Score<-0.2:"negative";"neutral").
Computed column settings:
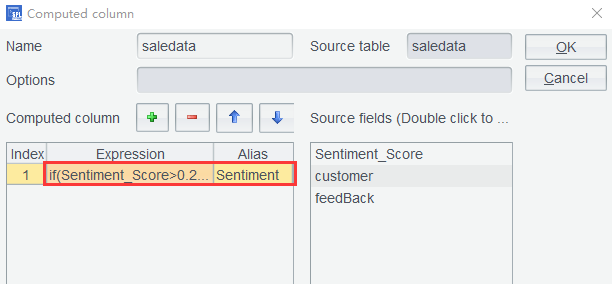
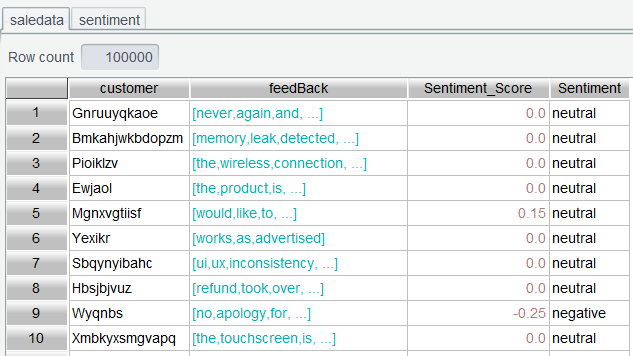
Sentiment scores whose ranking values are greater than 0.2 are interpreted as positive, those whose ranking values are less than 0.2 are interpreted as negative, and all the others are interpreted as neutral. The final result set is as follows:
The analysis helps to quickly understand the general customer sentiments. For example, you may find that:
• 65% of the feedbacks are positive, 20% of them are negative, and 15% are neutral.
• Some products have noticeably more negative feedbacks than others.
• Customers coming from certain areas give more positive feedbacks.
• Customer sentiments show a trend of improvement over time.
These insights can help businesses:
• Locate links that need to be improved;
• Track the effectiveness of product service optimization.
7.4 Analyzing most discussed topics by customers
In addition to the sentiment tendency, you may want to know the specific topics mostly discussed by customers. We can implement a simple keyword-based topic classification process.
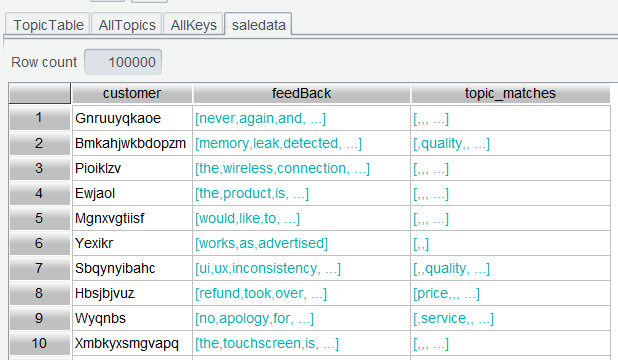
Step 1: Retrieve customer names and feedbacks from the sales data, and transform the feedbacks to sequences of words. The result set is the same as the that in the preceding example:
Step 2: Generate a simple topic vocabulary table:
Execute the following code in Edit Command Zone:
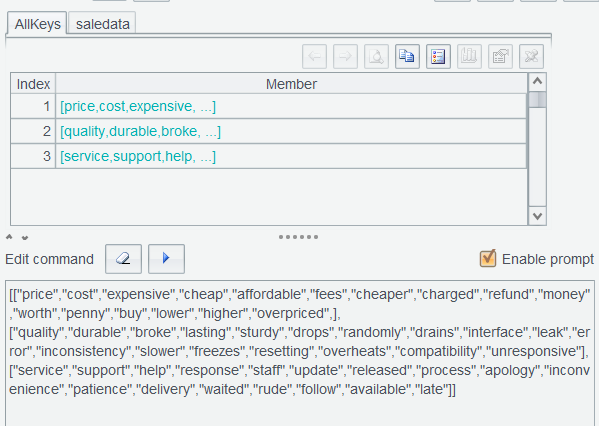
[["price","cost","expensive","cheap","affordable","fees","cheaper","charged","refund","money","worth","penny","buy","lower","higher","overpriced",],
["quality","durable","broke","lasting","sturdy","drops","randomly","drains","interface","leak","error","inconsistency","slower","freezes","resetting","overheats","compatibility","unresponsive"],
["service","support","help","response","staff","update","released","process","apology","inconvenience","patience","delivery","waited","rude","follow","available","late"]]
And generate a nested sequence, whose members are also sequences. Each sub-sequence belongs to one topic. Name the execution result AllKeys:
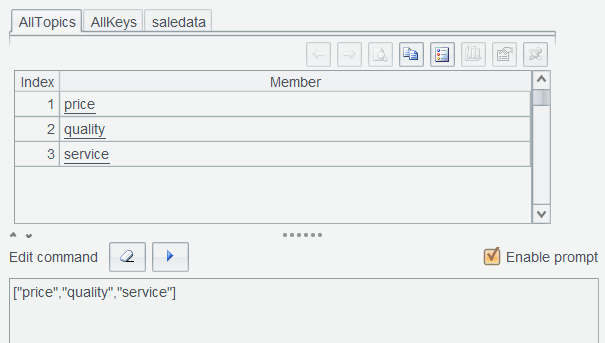
Execute ["price","quality","service"] again and name result set AllTopics :
Then combine AllKeys and AllTopics to generate a data table by executing AllKeys.new(~.sort():Keys, AllTopics(AllKeys.#):Topics) and name result set TopicTable :
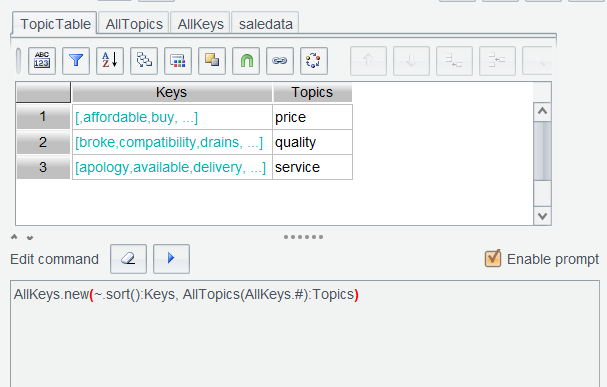
Learning point : new() function computes a sequence to generate a new table sequence. Find detailed uses HERE.
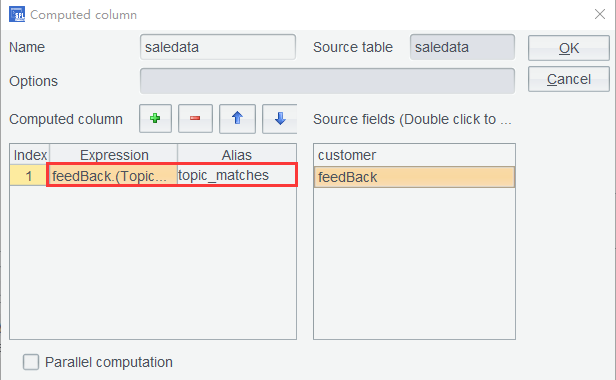
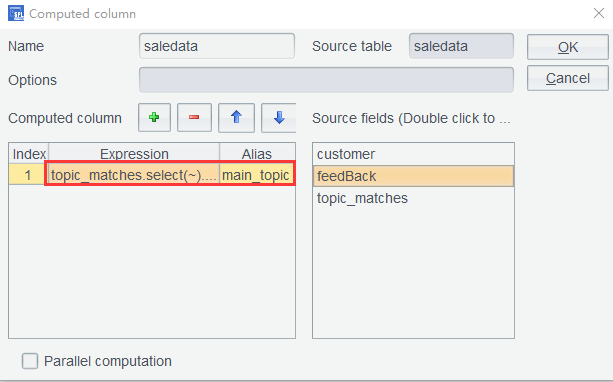
Step 3: Add a computed column to saledata table – use expression feedBack.(TopicTable.select@1(Keys.contain@b(feedBack.~)).Topics) to find Topics value corresponding to each row of feedBack . As a feedBack value is a sequence of words, it may contain multiple topics. So, TopicTable .select@1 means finding the first eligible record and then stopping the search.
Computing result:
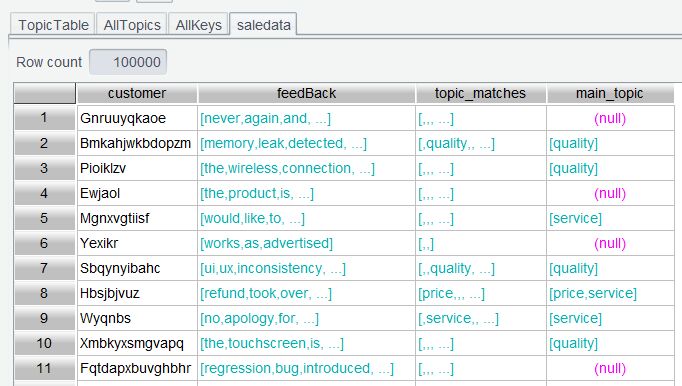
Step 4: Find the most frequently appearing topic from each topic_matches value using expression topic_matches.select(~).groups(~:topics;count(1):c).maxp@a(c).id(topics).
Add a computed column:
As the learning point in Section 2.5 shows, maxp@a(c) selects all eligible ones if the maximum value is more than one. Here is the result set:
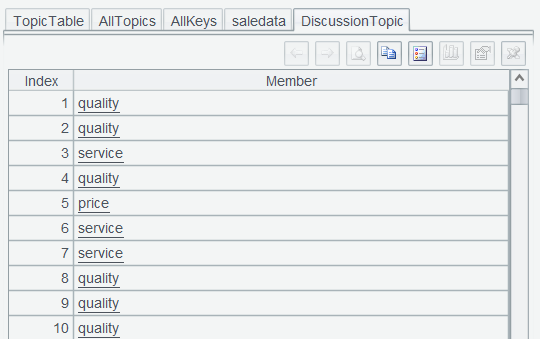
Step 5: Concatenate all topics obtained in saledata into a large sequence:
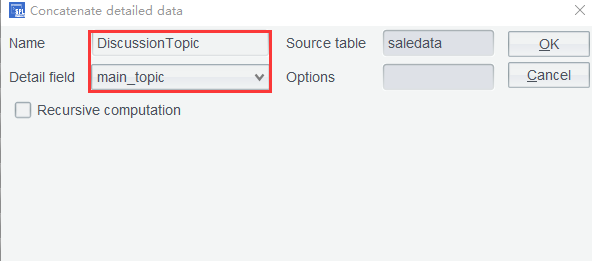
The result sequence:
Step 6: Count the frequencies of each topic and find the mostly frequently discussed topic. Execute DiscussionTopic.groups(~:Topic;count(1):Count) in Edit Command Zone and get the final result set:
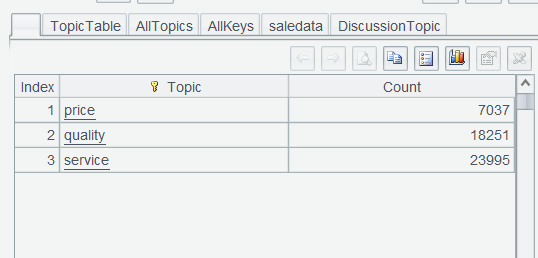
We can see that customers have the most interest in the after-sales service (service). And you need to put more effort into after-sales service to provide customers with the best possible experience.
SPL Official Website 👉 https://www.esproc.com
SPL Feedback and Help 👉 https://www.reddit.com/r/esProcSPL
SPL Learning Material 👉 https://c.esproc.com
SPL Source Code and Package 👉 https://github.com/SPLWare/esProc
Discord 👉 https://discord.gg/sxd59A8F2W
Youtube 👉 https://www.youtube.com/@esProc_SPL

