

6. Table association
5. Row-to-column/column-to-row pivot
6.1 Simple replacement with code table
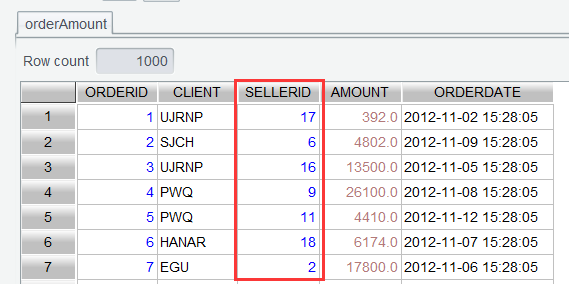
As a measure for storage efficiency, sometimes we choose to store values of certain columns of a database table as corresponding codes in a related table. For example, order amount table ( orderAmount ) below has a SELLERID column storing ID values, making it inconvenient to view:
And employee table has the corresponding codes and names:
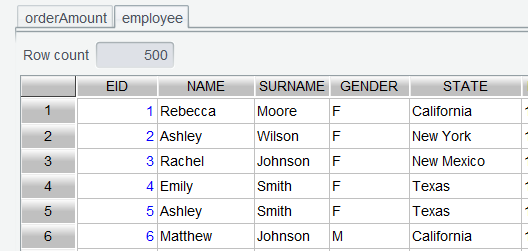
We want to replace values of orderAmount ’s SELLERID field with employee table’s SURNAME plus NAME .
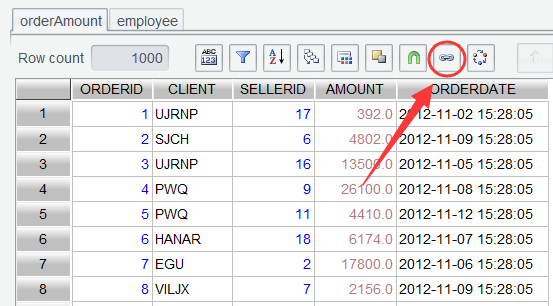
Step 1: In orderAmount , click Join icon:
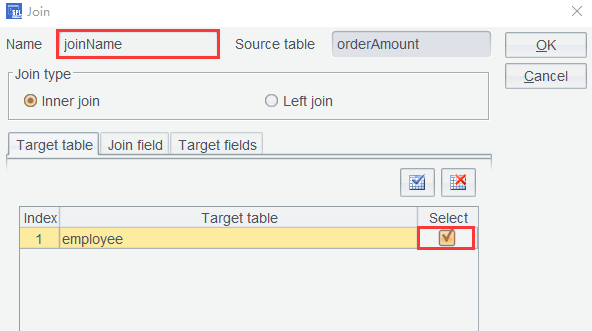
Set the joining result table name and select the target table to be joined:
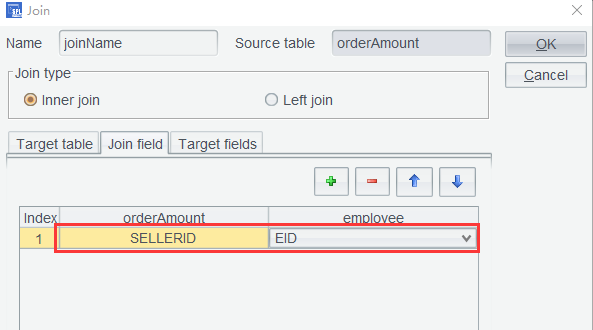
And select the join field:
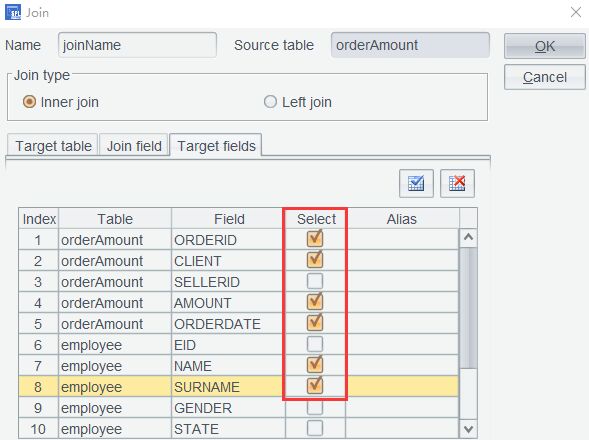
Then select target fields as follows:
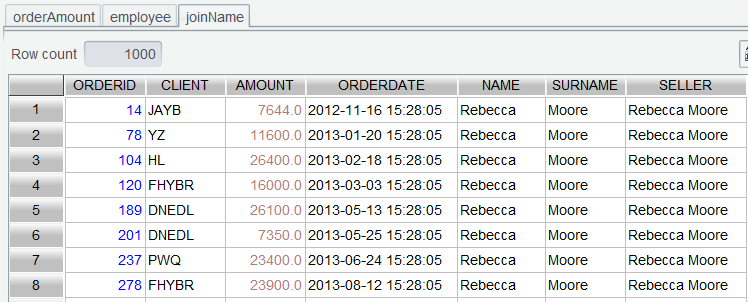
Click OK and the newly-generated joinName table has names and surnames associated to orderAmount table:
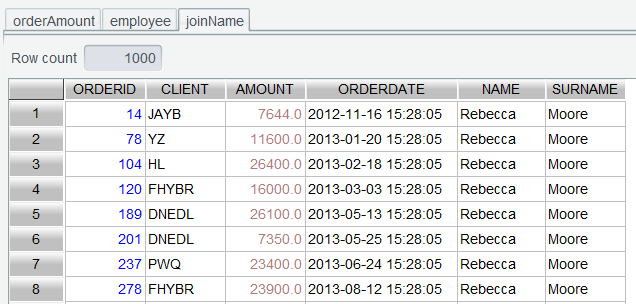
In the joining result table, names and surnames are still stored separately. We need to combine them together under SELLER column.
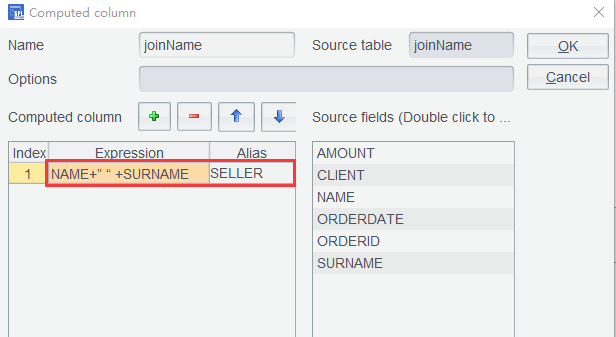
Step 2: Add a computed column in joinName table and use expression NAME+” “+SURNAME to generate its values:
The new order amount table with new column SELLER :
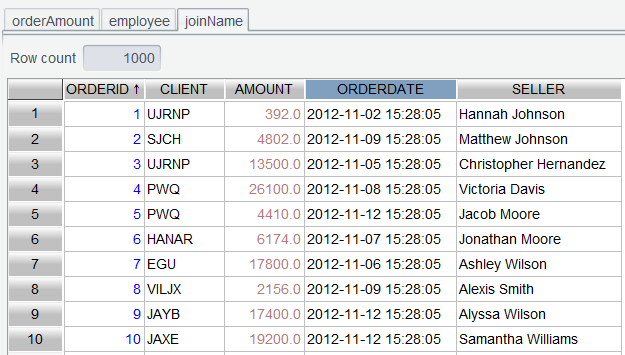
Step 3: Delete the now useless NAME and SURNAME columns from joinName , and sort rows by ORDERID in ascending order to generate a neat order table:
6.2 Associate worksheets to compute salaries
Salary.xlsx stores employees’ standard salary, absence records and performance respectively in different sheets. Now we want to attach absences and performance to the standard salary table according to employee IDs and compute the actual salaries.
Unlike a text file, the Excel spreadsheet can store multiple data tables. Double-click an Excel file, and by default, the table on the first sheet is opened.
Step 1: Select a file from the list and click Browse icon to open the target sheet:
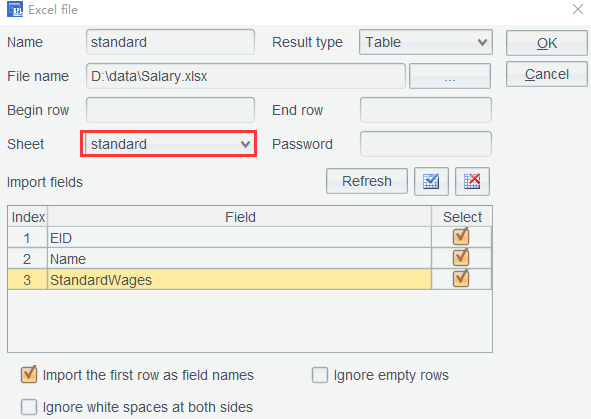
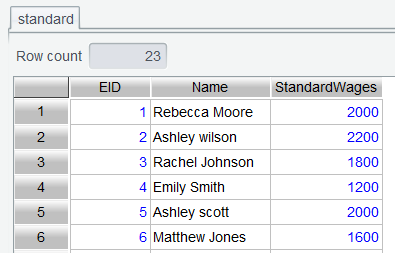
Open the three tables one by one. Below is the standard salary table:
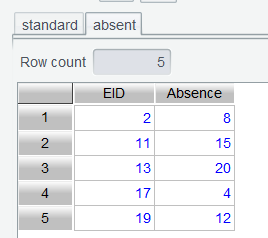
Absence table:
And performance table:
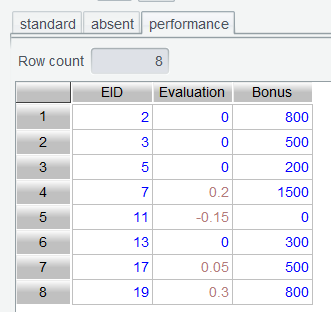
Both the absence table and the performance table use employee IDs ( EID ) to record the corresponding information. The three tables use same join field. Tables like them are called homo-dimension tables. Multiple homo-dimension tables can be joined through one association.
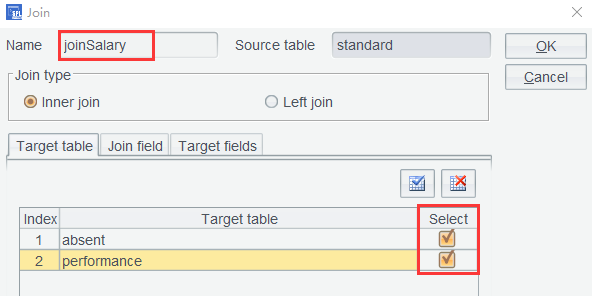
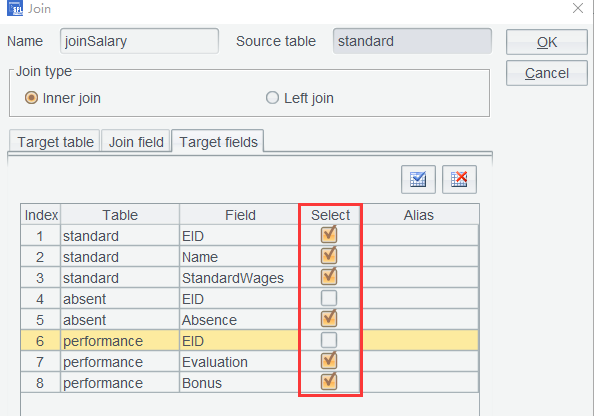
Step 2: In standard salary table ( standard ), click Join icon to select two target tables, as the following screenshot shows:
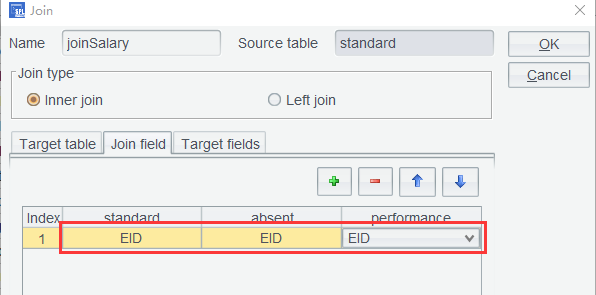
Then set the join field:
And select fields to be shown in the result table:
The result joining table is:
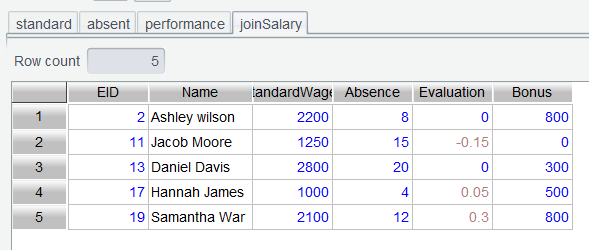
It seems that we get a wrong result table, where the number of employees becomes much smaller. There are two types of associations between tables: inner join and left join. The inner join is more commonly used. One example is the join of order table and order details table, during which an order record without a matching details record is treated as an invalid one. In our example, SPL WIN by default uses the inner join.
Learning point: The inner join is an operation that joins two or more tables based on their same fields (usually having a primary key-foreign key relationship). It requires that there is at least one row respectively in the queried tables match according to the join condition. If a row in a table does not have a match in the other table according to the condition, it will not appear in the result set.
For the current table in this example, only the employee record having a matching record in both the absence table and the performance table appears in the inner join result set. As only some employees have the absence records and only some of them get performance bonus, the join should be based on the left table, which is the employee standard salary table ( standard ) in our join scenario. The number of employees in the joining result set should be the same as that in the table.
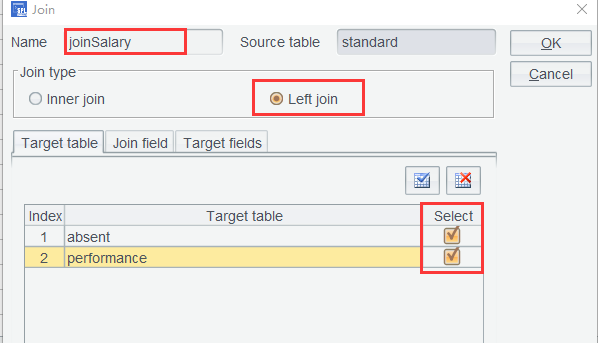
Delete the current joinSalary table, and perform settings for the join operation again on standard table while selecting Left join:
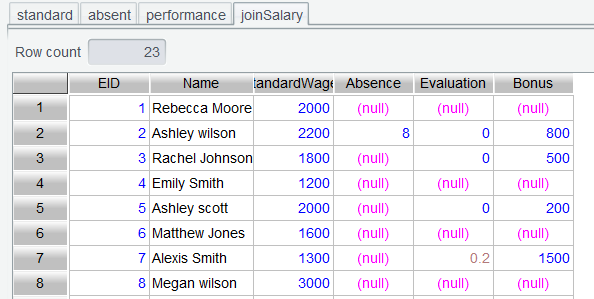
Perform subsequent steps the same way, and get the following joining result set:
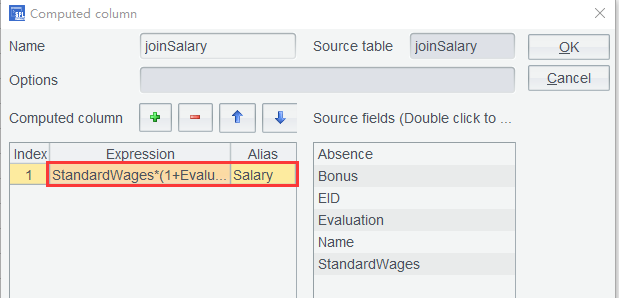
Step 3: Use the following formula to compute bonus and absence on joinSalary table:
StandardWages*(1+Evaluation-Absence/40)+Bonus
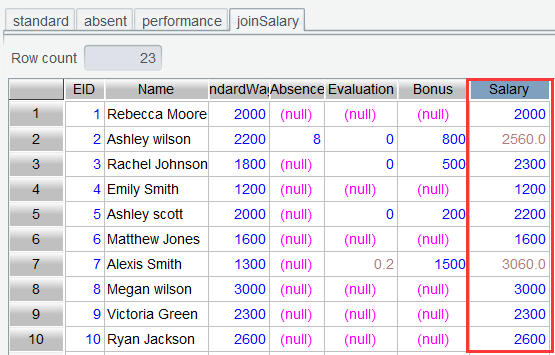
Add a computed column to compute the actual salary:
Click OK and get each employee’s actual salary ( Salary ):
6.3 Compute total sales per product per month
In the previous sections, we by default double-click a file to open it as a table. Each time all data is retrieved though it is convenient. Sometimes actually, the analysis does not involve all data columns. And the extra columns retrieved increase unnecessary memory space usage.
So, in this section, we only retrieve useful data columns from saledata.csv . In the following example, as aggregation is specified on sales amounts, payment dates rather than order dates need to be retrieved. It is more reasonable to sum sales amounts according to the actual payment dates.
Step 1: Select saledata.csv from the file list, click Browse button, and select the target columns:
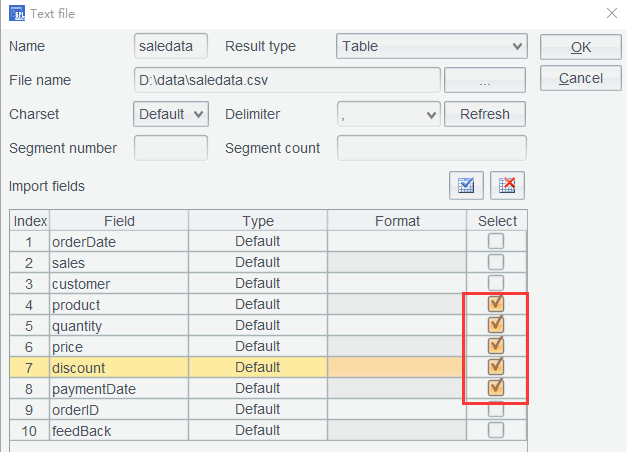
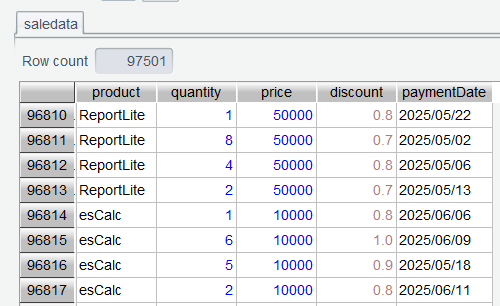
Click OK to get a data table containing only the selected columns:
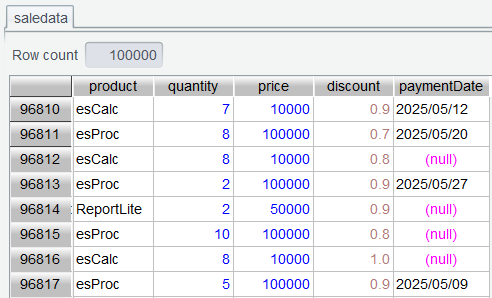
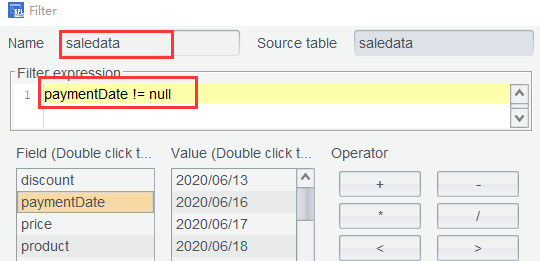
The table contains unpaid orders (where paymentDate value is null ). Use a filter expression again paymentDate!=null to remove records of the unpaid orders:
And get the following filtering result:
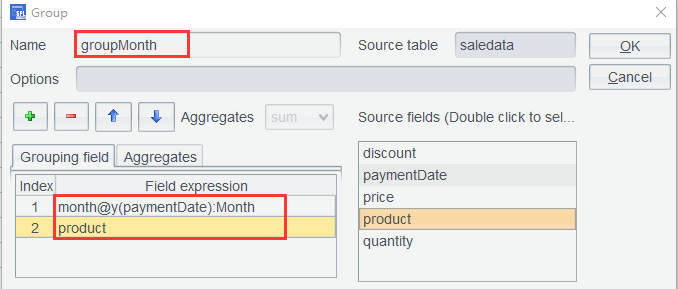
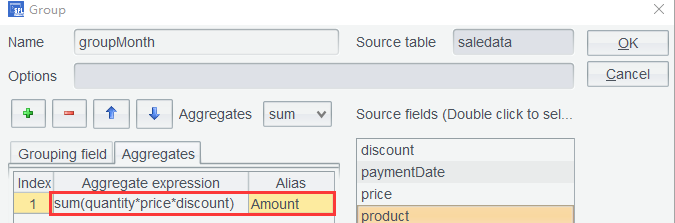
Step 2: Group and compute sales amount by month and by product. In expression month@y(paymentDate), @y option means returning an integer of yyyyMM format:
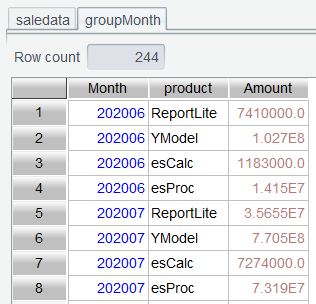
Below is result of grouping by month:
6.4 Compute MoM growth rate for each monthly sales
Pivot product values in groupMonth table to new column headers and compute MoM growth rate (crosstab).
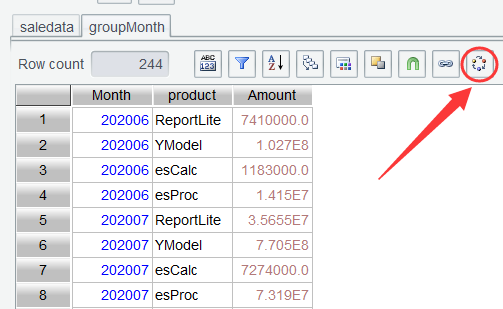
Step 1: Click Pivot icon in groupMonth :
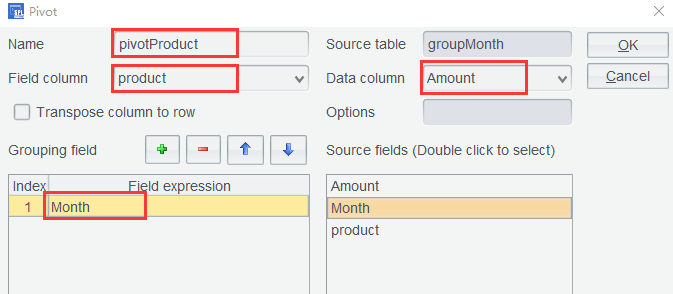
And perform pivot settings:
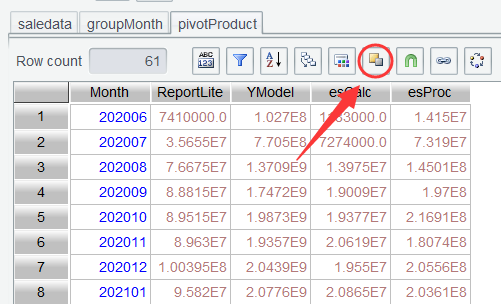
The pivot result:
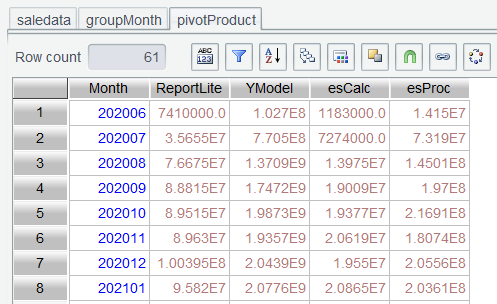
With the chronologically ordered product sales table ( pivotProduct ), it is rather convenient to compute MoM growth rate by product – just append a MoM computed column. But here we compute the MoM through Selected Fields. There is difference between Add Computed Columns and Selected Fields. Add Computed Columns appends computed columns after the existing columns in the source table without changing table structure, while Selected Fields computes specified expressions on columns of the source table to generate a table with a new structure. The latter is flexible as it allows selecting only the necessary columns and adjusting order of the columns in the result set.
Step 2: Click Select Fields icon in pivotProduct table:
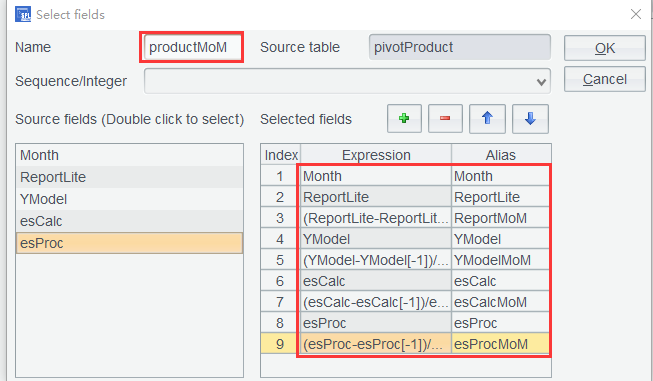
Set name of the new table and expressions for generating new columns as the following screenshot shows. Rows 3,5,7,9 are similar to:
(ReportLite-ReportLite[-1])/ReportLite[-1]
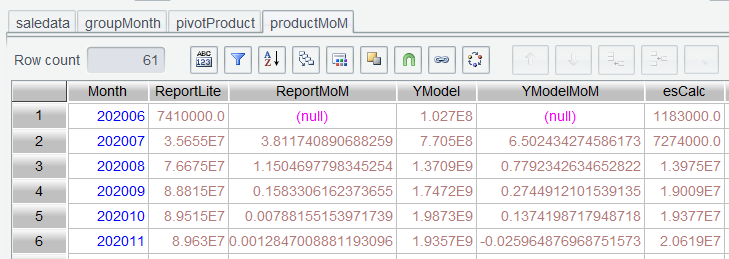
Below is the table of MoM growth rates per product per month:
6.5 Gross profit tracking
Select order records of October 2024 and find daily gross profit target achievement for each date.
Gross profit formula: product’s actual price – product’s cost price
Cost prices are stored in product table ( product ), and actual prices are stored in sales table ( saledata ). To compute gross profit, the two tables need to be joined.
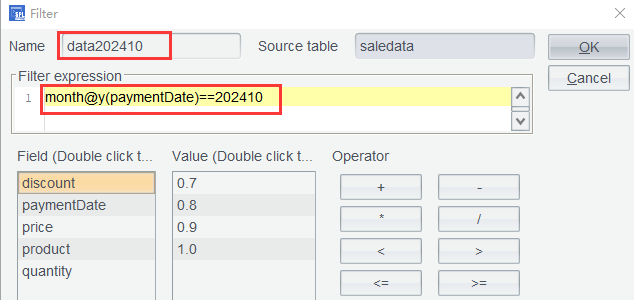
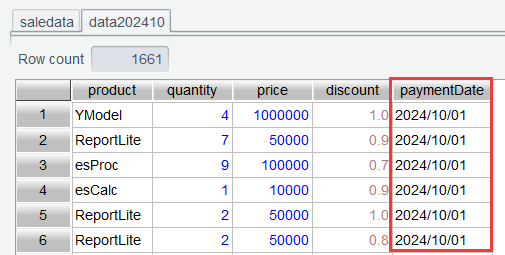
Step 1: Delete all tables except for saledata table generated in the preceding section. Compute filter expression on saledata to select records of October 2024:
And get the following result table:
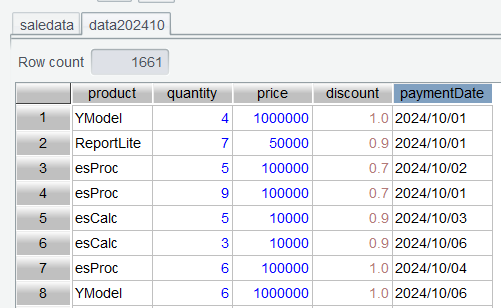
Sort the table by paymentDate in ascending order to compute daily cumulative sum:
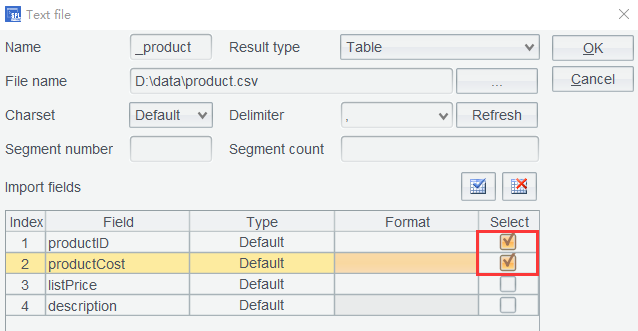
Step 2: Click Browse button to open product.csv from the file list and select fields to be imported as the following screenshot shows:
Open _product table:
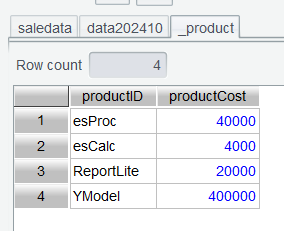
Note: As product is a function keyword in SPL, an underscore is automatically added before it to differentiate from the keyword “product”. It is important that you do not change the table name back to one namesake with the keyword, otherwise error will be reported later during computing the expression and probably you will not even figure out the cause.
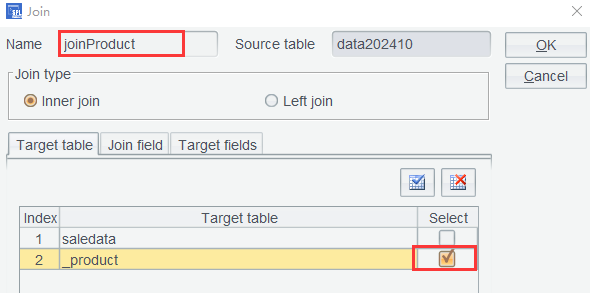
Step 3: In data202410 table, click Join icon and select tables involved in the operation as the following screenshot shows:
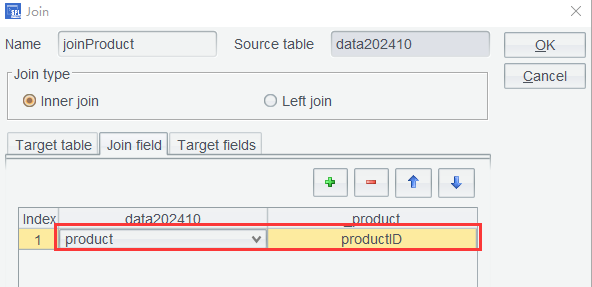
Set the join field:
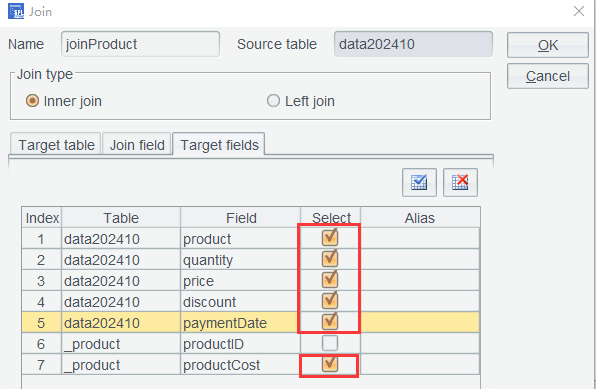
And the target fields to be selected:
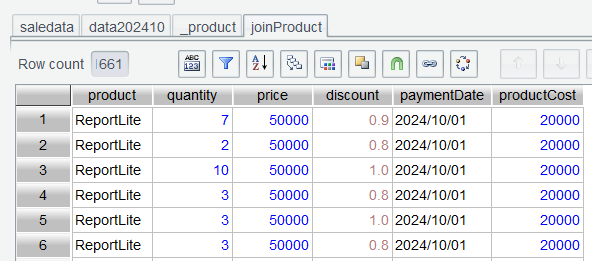
And get the joining result table:
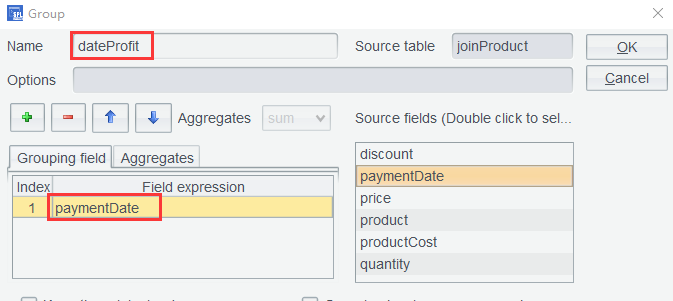
Step 4: On joinProduct table, perform grouping by payment date to compute gross profit:
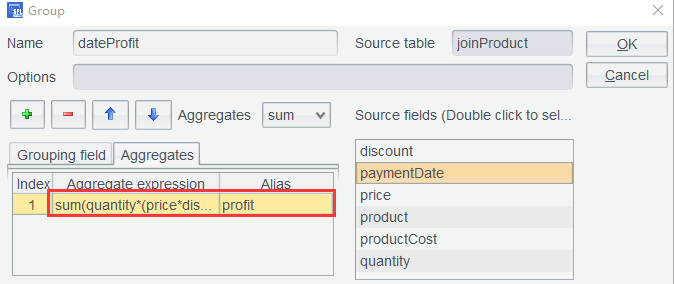
And use aggregate expression sum(quantity*(price*discount-productCost)) to compute the gross profit margin:
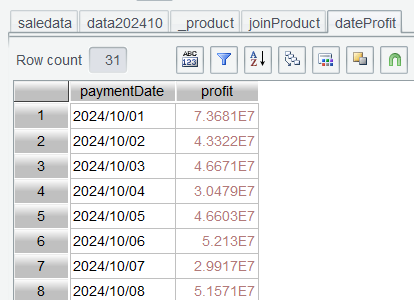
Generate a daily profit table:
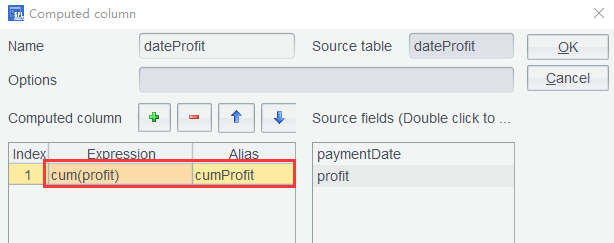
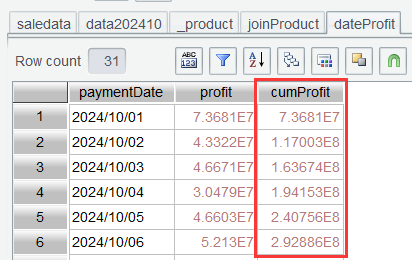
Step 4: Add a computed column to dateProfit table through computing expression cum(profit) to compute the cumulative gross profit:
The cumulative gross profits:
SPL Official Website 👉 https://www.esproc.com
SPL Feedback and Help 👉 https://www.reddit.com/r/esProcSPL
SPL Learning Material 👉 https://c.esproc.com
SPL Source Code and Package 👉 https://github.com/SPLWare/esProc
Discord 👉 https://discord.gg/sxd59A8F2W
Youtube 👉 https://www.youtube.com/@esProc_SPL

