

5. Row-to-column/column-to-row pivot
5.1 Pivot subjects to column headers
Generally, subjects offered for students from different majors are dynamic and not suitable to be used as column names. On the other hand, people prefer to use subject names as column headers for report presentation. The following screenshot shows student scores table ( scores ):
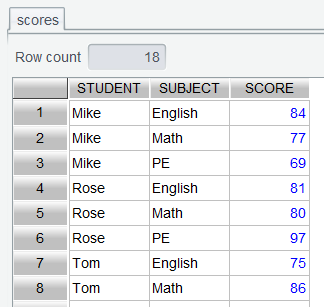
Let’s look at how to turn names under subject column to column headers.
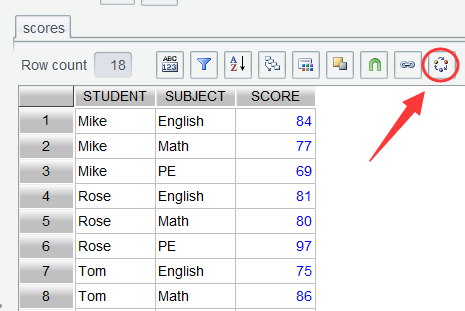
Step 1: In scores table, click Pivot icon:
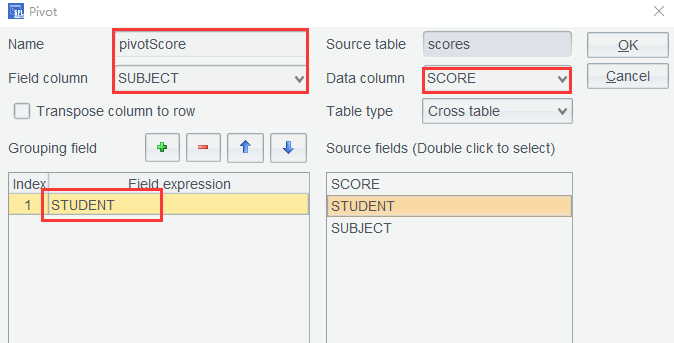
Step 2: On Pivot window, perform the following settings highlighted by red boxes: set Field column as SUBJECT to turn names under Subject column to field names; set Data column as SCORE ; and set Grouping field as STUDENT to group rows by student names:
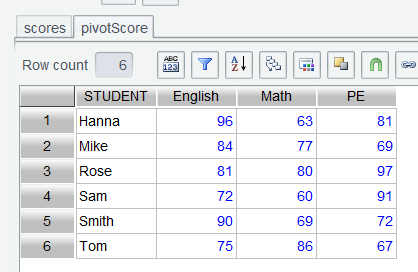
Click OK and the score table is transformed to a crosstab, where each student occupies a row and subjects become column headers:
5.2 Pivot subjects from column headers to row values
It is convenient to view and record scores using a table where subjects are column headers. But sometimes they need to be turned to a certain format for convenience of database storage.
Same as Section 5.1, first click Pivot icon in pivotScore table, set table name (highlighted by red box) after the transposition, and perform other settings as the row-to-column transposition does. The only difference is that Transpose column to row needs to be checked:
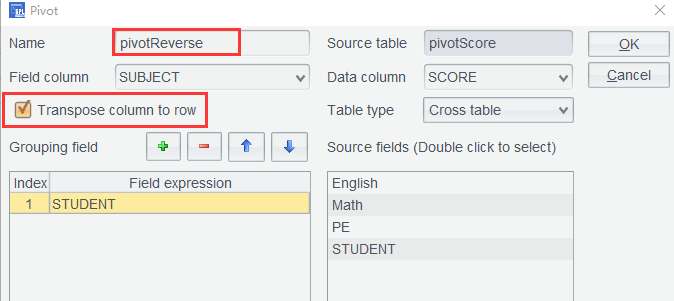
Click OK and subjects are converted back to data rows:
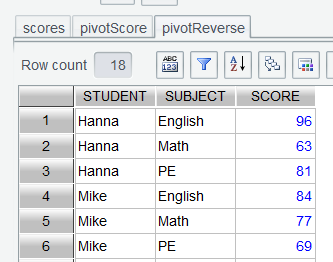
SPL WIN can remember all the operation steps. So, the column-to-row pivot inherits the preceding settings for Field column and Data column. And generally, they need to be specially and manually named.
5.3 Pivot subjects to row-based extend table
When printing individual student report cards, a crosstab format is less convenient. Instead, it would be preferable to display each student’s subjects and corresponding grades side by side in a single row. This way, there is no need to edit subjects repeatedly.
The settings are basically same as those in Section 5.1, having only slight differences for certain properties. In pivotReverse table, click Pivot icon and perform settings in same way for Section 5.1. Not properties highlighted in red boxes:
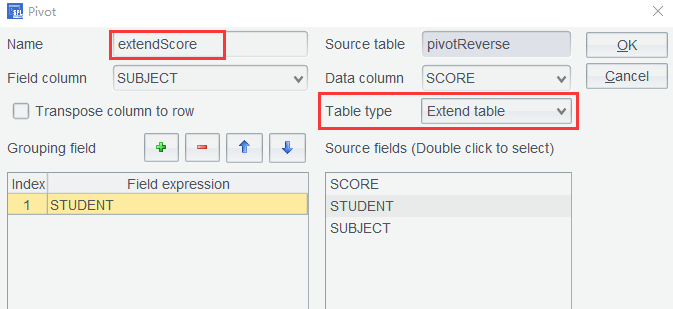
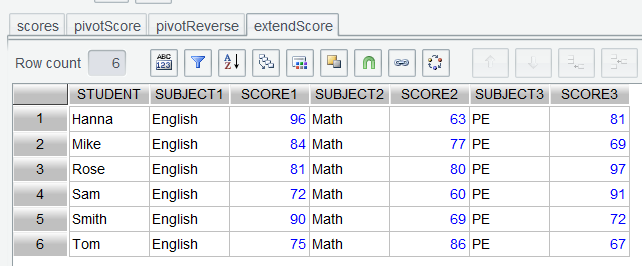
Select Extend table under Table type. Click OK to get a transposed table extended by subjects:
5.4 Pivot an extend table to row-based table
Likewise, an extend table can be turned back to a row-based table.
In extendScore table, click Pivot icon and perform same settings as we do in Section 5.2. Note the different properties highlighted in red boxes:
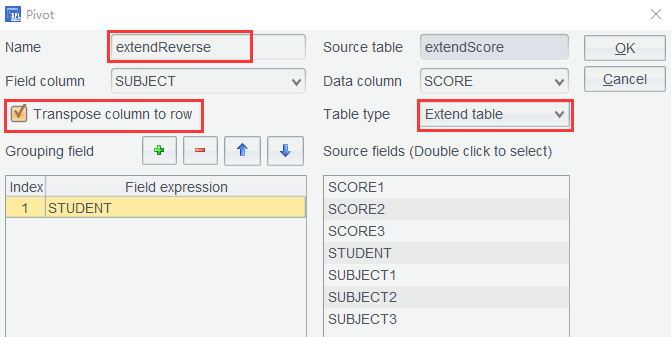
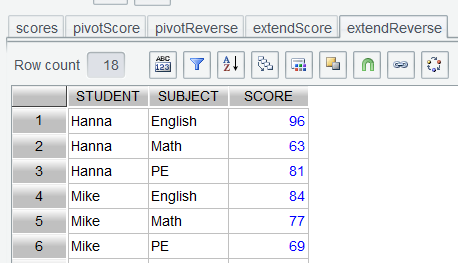
Similarly, check Transpose column to row, set names for Field column and Data column and the corresponding Table type as Extend table. Click OK to get a row-based score table:
5.5 Population census table
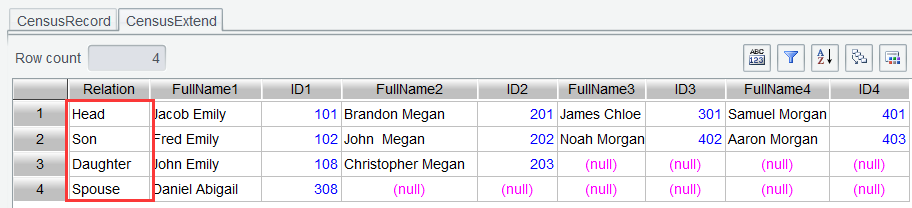
During the population census, household registration officers conduct door-to-door surveys to register permanent residents by household within each residential community. For convenience, all family members are registered consecutively in sequence. The following CensusRecord is an example of such a table:
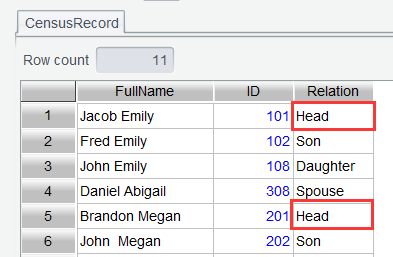
As the above screenshot shows, under Relation column each family consists of an indefinite number of rows, which include the Head member row and rows of the other family members. Clearly, to print the family roster for each household, it is necessary to consolidate all data rows within each family into a single data row, which facilitates processing on a per-family basis.
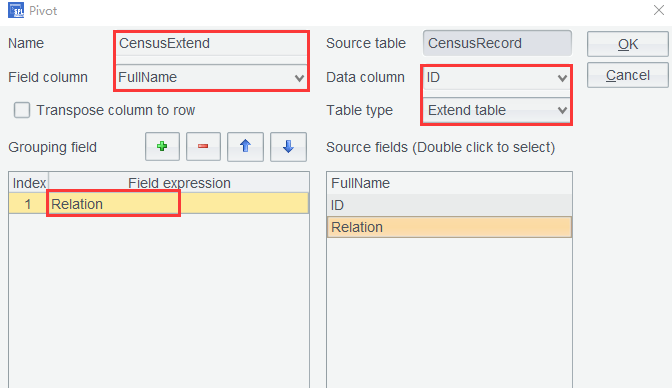
Now we try to turn the above register table to an extend table where each family occupies a row. First, group rows by Relation according to the following settings:
Click OK to get the result:
According to the relation data highlighted in red box, the pivot result isn’t what we expect though it is correct after rows are grouped by Relation . This is because the grouping operation puts all rows with same Relation value in the same group.
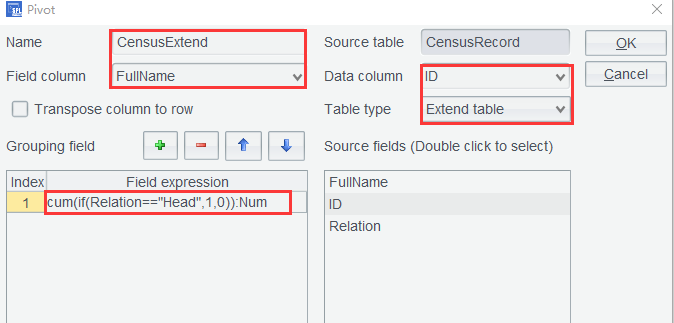
When a grouping operation by an existing column cannot bring the expected result, we can try to perform the grouping by a specified expression that can put the ordered family members in a same group. As each household only has one head ( Head ), we can use an expression to judge whether the Relation value in each row is a head or not. Record 1 if it is; and 0 if it isn’t. Then group rows by the cumulative count. This way each members of each family will be put in the same group.
Use expression cum(if(Relation=="Head",1,0)):Num on CensusRecord again to perform the transposition settings:
Now the pivot result is as follows:
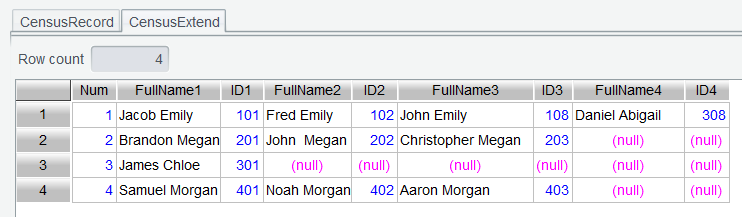
You can see that each Head value is pivoted to a column value, with other members within the family placed after it in separate columns.
Learning point : cum() is a cumulative sum function, which makes it unnecessary to first reference the neighboring value and then compute the cumulative sum. Find detailed uses HERE.
SPL Official Website 👉 https://www.esproc.com
SPL Feedback and Help 👉 https://www.reddit.com/r/esProcSPL
SPL Learning Material 👉 https://c.esproc.com
SPL Source Code and Package 👉 https://github.com/SPLWare/esProc
Discord 👉 https://discord.gg/sxd59A8F2W
Youtube 👉 https://www.youtube.com/@esProc_SPL

