

1. Preparation
1.1 Download and installation
The free SPL Desktop Edition is enough.
Download SPL HERE.
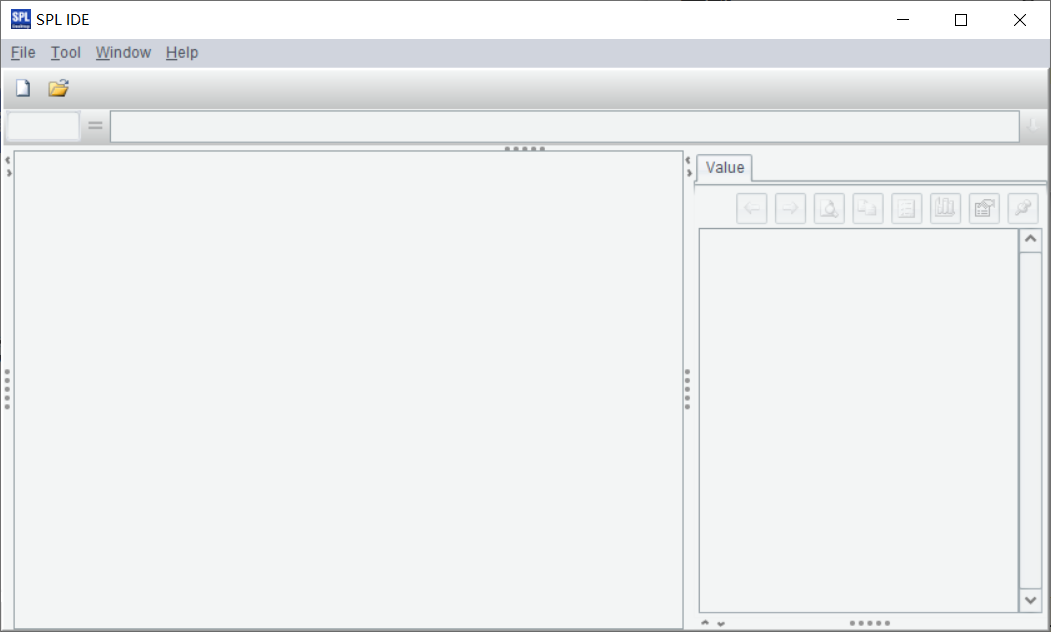
After downloading, install SPL according to the Wizard’s instructions. Then run SPL IDE, whose interface is as follows:
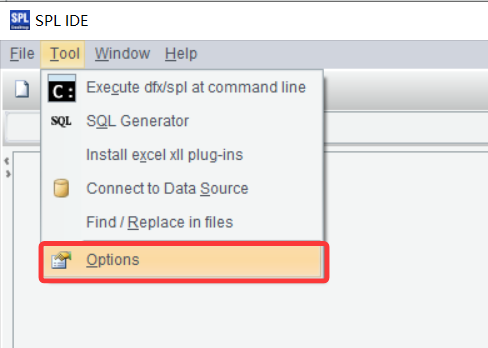
Click Tool/Options to set the main path:
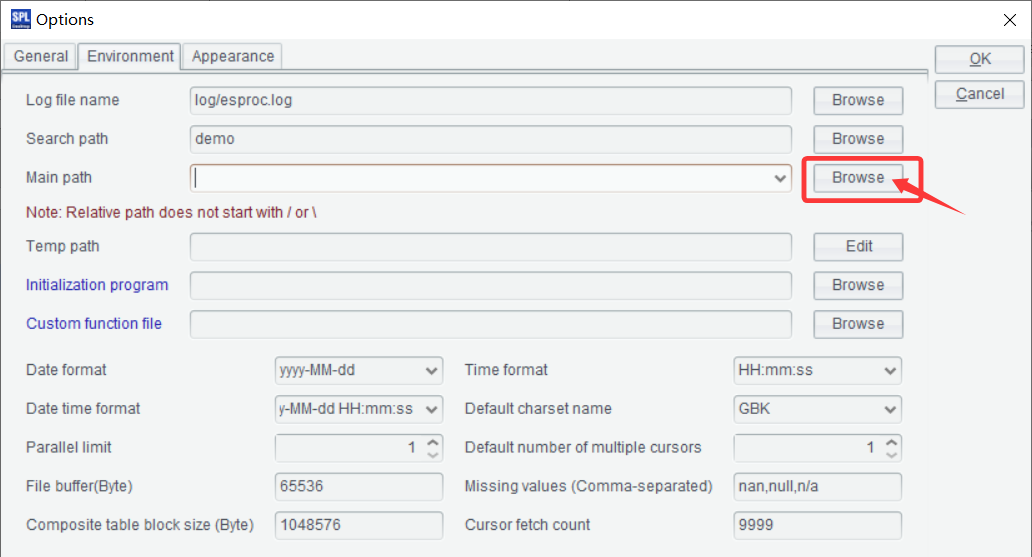
After that, put all data files and script files this document uses in the main path. Later when you need to reference a file in the script, you do not need to specifically specify the path name, creating concise and easy to read code.
1.2 Grid-based programming
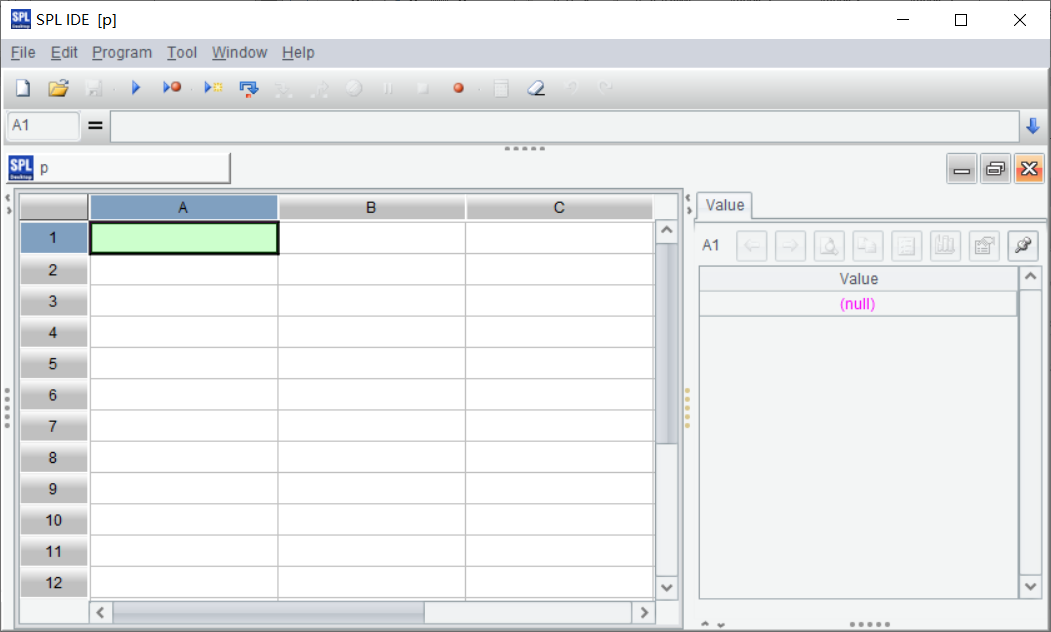
Click File/New on the SPL IDE’s main interface, we get an Excel-like grid-based interface:
SPL innovatively adopts the Excel-like grid-based programming to perform data computing on an intuitive two-dimensional cellset layout rather than with the conventional text code. Such a coding format is particularly suitable for dealing with complex data computing tasks. It has the following characteristics:
- Visualized and Intuitive: The computing logic is displayed in a cellset layout, where cells are independent and interrelated.
- Modular design: Each cell can work as an independent computing unit, making it convenient to maintain and reuse.
- Controllable computation order: The computation order is naturally displayed through the cellset layout, creating clear logic.
- Instant feedback: Result of each cell is instantly displayed, making the debugging process highly efficient and intuitive.
1.2.1 WYSIWYG interface
In SPL’s grid-based interface, all cells’ code and results can display simultaneously. When coding is completed, the current cell can be independently computed and its result is displayed separately. This instant feedback mechanism significantly increases development efficiency.
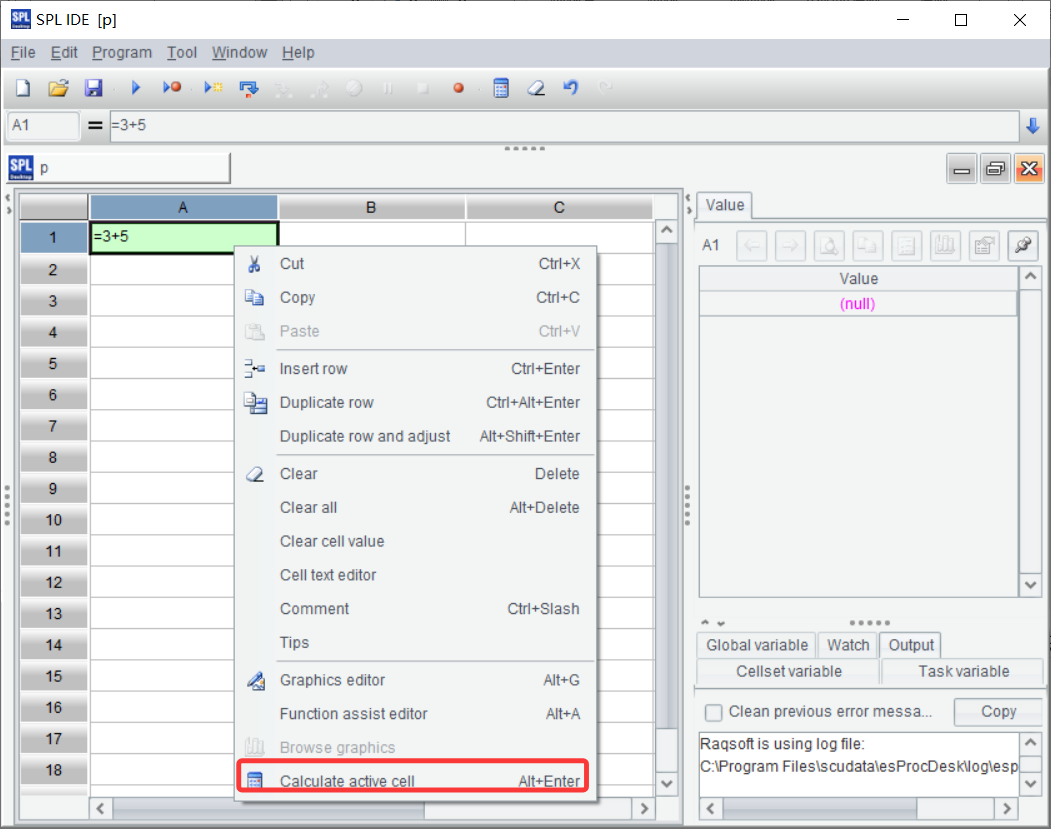
As the above screenshot shows, type in =3+5 in cell A1. Then select A1, and click Calculate active cell on the right-click menu or press Alt+Enter to compute the currently selected cell.
=3+5 is like an Excel expression. In SPL, arithmetic operations Excel supports can all be computed. Try computing more arithmetic operations and find their similarities.
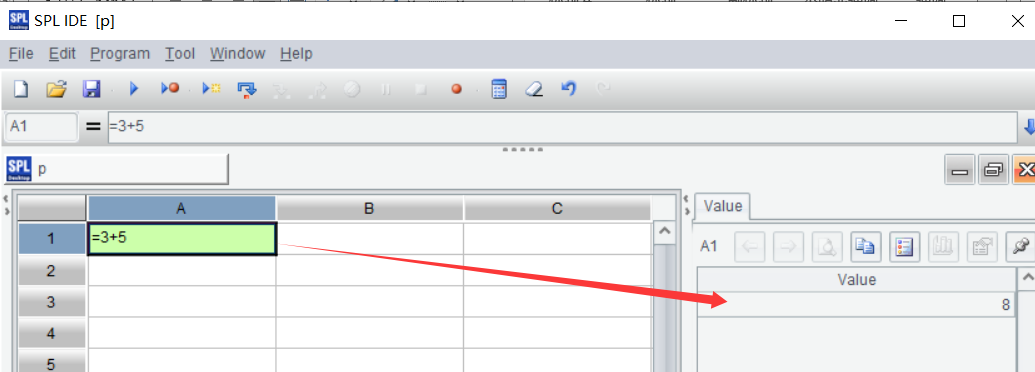
View result directly on the interface: In a cellset, result of each cell, including scalar values and table/chart, can be directly displayed on the right (as the following screenshot shows). The output of each computing step is visible.
Learning point: Differences and similarities between Excel and SPL
Similarities
- Both use grid-based interface;
- Both support arithmetic expression;
- Both can compute one cell at a time.
Differences:
-
Excel automatically computes the current cell once an expression is entered and carriage return or mouse is clicked; in SPL, you must select the current cell, and right click to select Calculate active cell or press Alt+Enter to enable the computation.
-
In Excel, result of a cell is directly displayed in the cell; in SPL, a result is displayed on the right part of the interface.
1.2.2 Cell naming and uses of variables
Naming a cell:
Similar to Excel, SPL also adopts grid coordinate system to identify and reference cells. Each cell is uniquely identified by the combination of its corresponding column label (a letter) and row number.
Example:
-
A1: The cell at the intersection of column A and row1
-
B3: The cell at the intersection of column B and row 3
-
AA100: The cell at the intersection of column AA and row 100
Referencing a cell:
- Reference a coordinate directly:
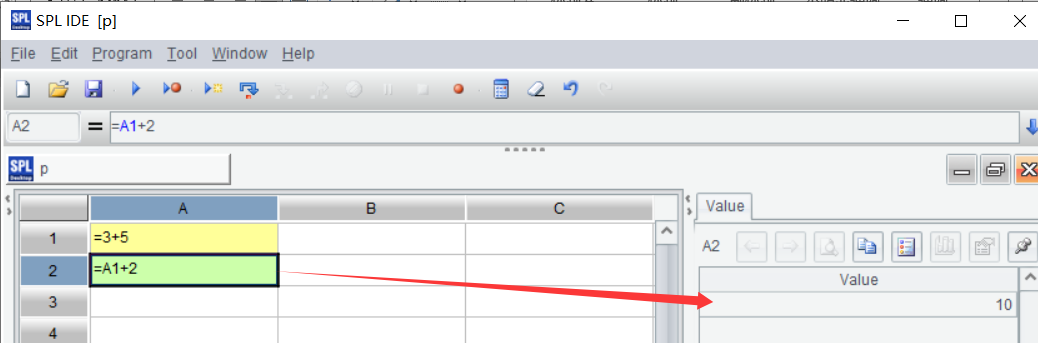
Reference A1’s value at cell A2:
Learning point:
A cell can act as a variable to be referenced or assigned in another cell. This gets rid of a lot of variable naming troubles. For data or variables having regular patterns, directly referencing a cell, instead of specifically naming a variable, is very convenient.
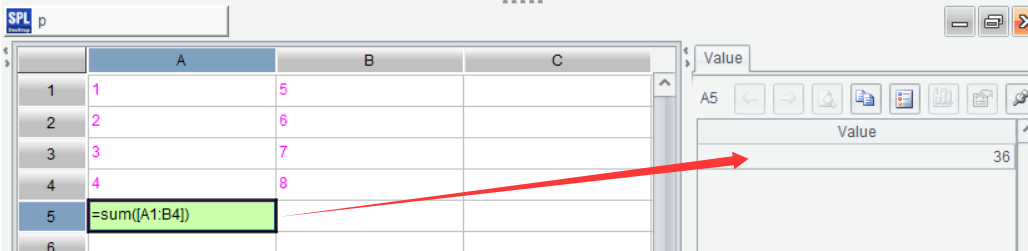
- Reference a cell range:
Compute the sum of values from A1 to B4.
Learning point: Differences and similarities between Excel and SPL
Similarities:
-
Both have same naming rules
-
Both use A1:B4 to represent a rectangular cell range from A1 to B4
-
Both can use sum() function to perform aggregate operation on a cell range
Differences:
- The Excel expression syntax for computing sum of values in a cell range is =sum(A1:B4); the SPL counterpart is =sum([A1:B4]) or [A1:B4].sum()
1.2.3 Independent computing unit
Each cell is an independent computing unit. It supports:
- Simple computations
- Complex data processing
- Conditional branch
- Loop processing
Result of a cell will be automatically passed to the dependent downstream cells to form a complete data stream.
1.2.4 Computing order in a cellset
In a SPL cellset, computations are performed from left to right and then from top to bottom:
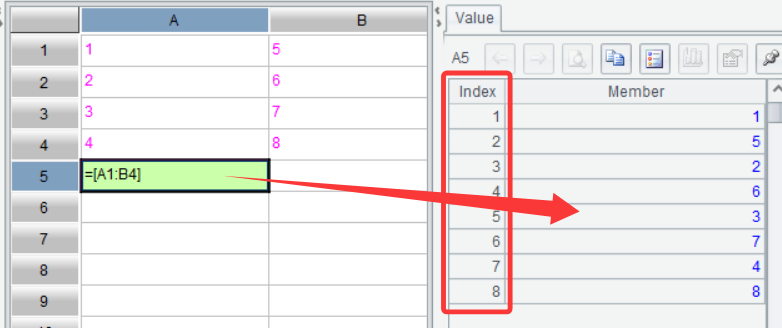
According to the return value of computing [A1:B4], the order of computations in cells is from left to right and then from top to bottom.
Learning point: Differences between Excel and SPL
Excel does not support directly displaying a data set like A1:B4 in cells; it has to summarize all values into a single one to display. SPL can directly display a data set in the format of =[A1:B4] and in order. In the above screenshot, column Index highlighted in red box contains sequence numbers of data. In SPL, such an ordered data set is called sequence.
SPL’s grid-based programming redefines data processing user experience by perfectly combining programming’s preciseness with spreadsheet’s intuitiveness. It offers a more efficient, more controllable data computing solution.
1.3 Data files used in the document
1.4 One simplest analytical use case
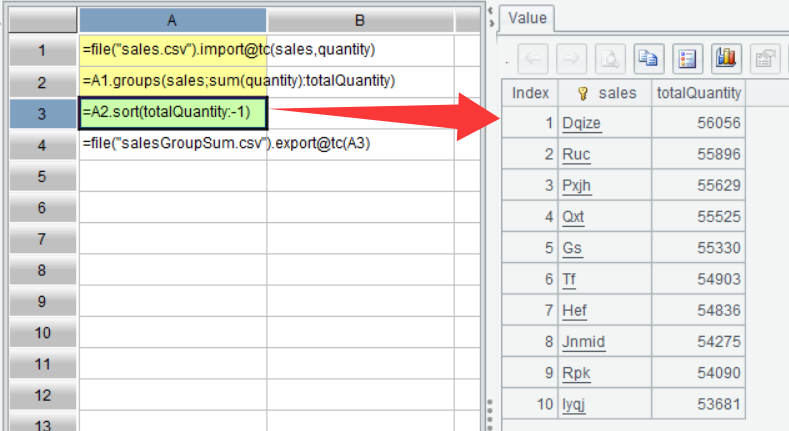
Read sales data from sales.csv, group data by sales, find the order quantity in each group, sort data by quantity, and write the final result to salesGroupSum.csv.
| A | |
|---|---|
| 1 | =file(“sales.csv”).import@tc(sales,quantity) |
| 2 | =A1.groups(sales;sum(quantity):totalQuantity) |
| 3 | =A2.sort(totalQuantity:-1) |
| 4 | =file(“salesGroupSum.csv”).export@tc(A3) |
A1 Read column sales and column quantity from sales.csv.
A2 Group data read in A1 by sales and compute quantity in each group.
A3 Sort A2’s grouping & aggregation result in descending order by totalQuantity.
A4 Write A3’s sorting result to salesGroupSum.csv.
It does not matter that you do not understand the code for the moment, just copy and execute it to feel the SPL programming. We’ll learn the related syntax in the following sections.
After executing the above cellset code, you can directly view A3’s result set to the right of the gridlines:
Open the main path and salesGroupSum.csv is already added. Open the file and you can see the following content:
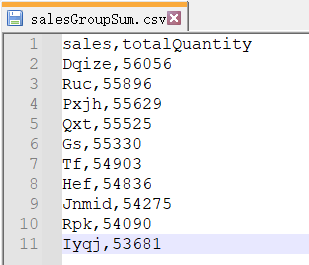
The content in the csv file is the same as the value of A3.
SPL Official Website 👉 https://www.esproc.com
SPL Feedback and Help 👉 https://www.reddit.com/r/esProcSPL
SPL Learning Material 👉 https://c.esproc.com
SPL Source Code and Package 👉 https://github.com/SPLWare/esProc
Discord 👉 https://discord.gg/sxd59A8F2W
Youtube 👉 https://www.youtube.com/@esProc_SPL

