

2.6 Fluctuation frequency
Fluctuation frequency is a derived series describing the number of fluctuations of the original values.
In simple terms, a fluctuation occurs each time the original values change trend direction. That is, each time the original values cross the main line counts as a fluctuation. Fluctuation frequency is then the count of these crossings over a defined period. Specifically, calculate the number of times the product of adjacent points in the fluctuation sequence Wv [-(l+1)]i+1 is less than zero.
The fluctuation frequency sequence F of time series X is calculated as follows:
Wv=X–M
fi=count(wvj*wvj-1<0)
Where M represents the main line, and wvj represents the j-th element in Wv [-(l+1)]i+1.
SPL routine:
| A | B | C | |
|---|---|---|---|
| 1 | =data=file(“1Ddata.csv”).import@tci().to(100) | /Time series X | |
| 2 | =l=5 | /Interval l | |
| 3 | =fit_main(A1,10) | /Main line M, k=10 | |
| 4 | =A1–A3 | /Fluctuation sequence Mv | |
| 5 | =A4.(if(#<=l,null,(s=~[-l:0],s.count(#!=1&&(~*~[-1]<0))))) | /Fluctuation frequency F | |
The main line M is calculated in Cell A3, with a balancing coefficient k=10.
The fluctuation curve Wv is calculated in Cell A4.
The fluctuation frequency F is calculated in Cell A5.
Calculation result example:
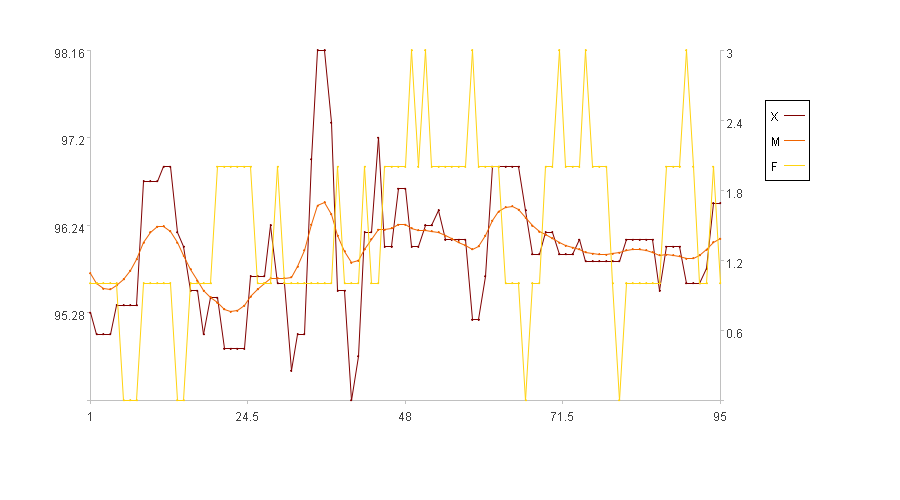
In the figure, the x-axis represents the sequence index, the left y-axis represents the values of the original series X, and the right y-axis represents the values of the fluctuation frequency F. In the legend, X is the original series, M is the main line and F is the fluctuation frequency (Because the first five time points have no fluctuation frequency, the figure only displays the fluctuation frequency for the subsequent 95 time points).
SPL Official Website 👉 https://www.esproc.com
SPL Feedback and Help 👉 https://www.reddit.com/r/esProcSPL
SPL Learning Material 👉 https://c.esproc.com
SPL Source Code and Package 👉 https://github.com/SPLWare/esProc
Discord 👉 https://discord.gg/sxd59A8F2W
Youtube 👉 https://www.youtube.com/@esProc_SPL

