

2.5 Fluctuation amplitude
Fluctuation amplitude is a derived series describing the magnitude of fluctuations in the original values.
In layman’s terms, the difference between the maximum and minimum values within a given time period can be used to represent the fluctuation amplitude W.
wi=ma-mi
Where ma and mi are the maximum and minimum values, respectively, within X[-l]i.
However, this calculation approach has a drawback: when X contains unusually large or small values (outliers), the effect on wi will persist for a duration equal to l, making it highly sensitive to outliers. Therefore, we consider removing outliers first and then calculating the fluctuation amplitude W based on the maximum, minimum, and current values of the normal data.
The fluctuation amplitude sequence W of time series X is calculated as follows:
wi=max(mu-md,mu-xi, xi-md)
mu=max(Norm(X[-l]i))
md=min(Norm(X[-l]i))
Where mu and md are the maximum and minimum values, respectively, of the normal data within X[-l]i, and Norm(…) represents a previously introduced outlier detection method (e.g., the box plot method, normal statistical method, or distance method) returning only normal data.
SPL routine:
| A | B | C | |
|---|---|---|---|
| 1 | =data=file(“1Ddata.csv”).import@tci().to(100) | /Time series X | |
| 2 | =l=5 | /Intervall | |
| 3 | =data.((if(#<=l,null,(xi=~,s=~[-l:-1],norm=func(A5,s,1.5), ma=max(norm),mi=min(norm),max(ma-xi,xi-mi,ma-mi))))) |
/Fluctuation amplitude W, using the box plot method with an interquartile range multiplier of 1.5 | |
| 4 | /Box plot method, returns normal data, parameters: sequence, interquartile range multiplier | ||
| 5 | func | ||
| 6 | =A5.median(:4) | ||
| 7 | =B6(1) | /Q1 | |
| 8 | =B6(3) | /Q3 | |
| 9 | =B8-B7 | /IQR | |
| 10 | =B7-B9*B5 | /td | |
| 11 | =B8+B9*B5 | /tu | |
| 12 | =A5.select(~>=B10&&~<=B11) | /Normal data | |
The fluctuation amplitude sequence W is calculated in Cell A3.
The code block in A5 uses the box plot method for outlier detection, returning all normal data. Alternatively, other outlier detection methods, such as the normal statistical method or distance method, can be used here.
Calculation result example:
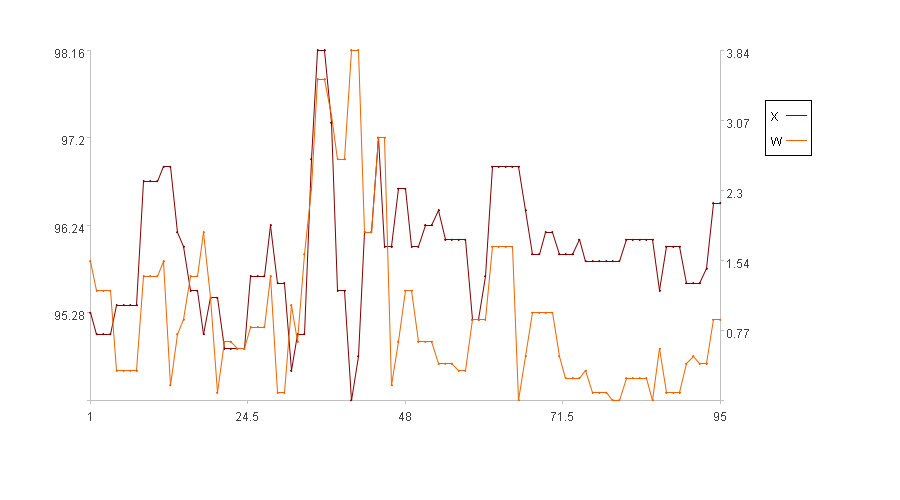
In the figure, the x-axis represents the sequence index, the left y-axis represents the values of the original series X, and the right y-axis represents the values of the fluctuation amplitude W. In the legend, X is the original series and W is the fluctuation amplitude (Because the first five time points have no fluctuation amplitude, the figure only displays the fluctuation amplitude for the subsequent 95 time points).
Fluctuation amplitudes calculated based on the maximum and minimum values consider only the magnitude of fluctuations in the original values themselves, without taking into account the trend of the original values. For example, when the original values exhibit an overall downward trend, the fluctuation amplitude will be large. Therefore, the fluctuation amplitude can also be calculated after considering the main line.
The sequence obtained by subtracting the original values from the corresponding points on the main line is called the fluctuation sequence, denoted as Wv. The fluctuation amplitude wi is determined by taking the mean of the absolute values of the top 50% of the elements within Wv [-(l+1)]i+1, ranked by absolute magnitude.
The fluctuation amplitude sequence W of time series X is calculated as follows:
Wv=X—M
tophi=top(-n\2,|Wv [-(l+1)]i+1|)
wi=avg(tophi)
Where |Wv [-(l+1)]i+1| indicates that all elements of Wv [-(l+1)]i+1 are converted to their absolute values, and tophi represents the elements in |Wv [-(l+1)]i+1| corresponding to xi that constitute the top 50% by absolute magnitude.
SPL routine:
| A | B | C | |
|---|---|---|---|
| 1 | =data=file(“1Ddata.csv”).import@tci().to(100) | /Time series X | |
| 2 | =l=5 | /Interval l | |
| 3 | =fit_main(A1,10) | /Main line M, k=10 | |
| 4 | =A1–A3 | /Fluctuation sequence Wv | |
| 5 | =A4.(if(#<=l,null,(s=~[-l:0],s.top(-(l+1)\2,abs(~)).avg()))) | /Fluctuation amplitude | |
The main line is calculated in cell A3 using the least squares method (the moving average method can also be used to calculate the main line).
The fluctuation amplitude sequence W is calculated in Cell A5.
Calculation result example:
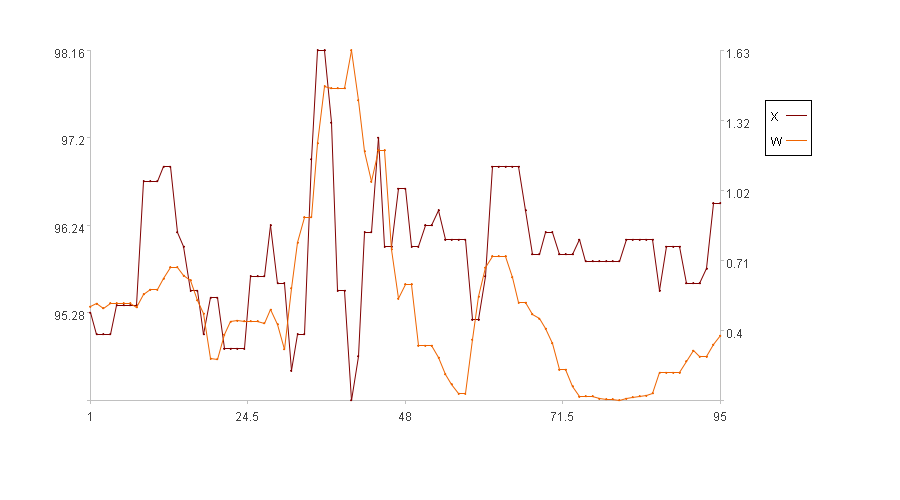
In the figure, the x-axis represents the sequence index, the left y-axis represents the values of the original series X, and the right y-axis represents the values of the fluctuation amplitude W. In the legend, X is the original series and W is the fluctuation amplitude (Because the first five time points have no fluctuation amplitude, the figure only displays the fluctuation amplitude for the subsequent 95 time points).
SPL Official Website 👉 https://www.esproc.com
SPL Feedback and Help 👉 https://www.reddit.com/r/esProcSPL
SPL Learning Material 👉 https://c.esproc.com
SPL Source Code and Package 👉 https://github.com/SPLWare/esProc
Discord 👉 https://discord.gg/sxd59A8F2W
Youtube 👉 https://www.youtube.com/@esProc_SPL

