

1.5 Extreme values
Each of the box plot, normal statistical, and distance methods uses the entire data of X[-k]i to learn tu and td , resulting in relatively high computational complexity – especially the distance method, whose computational complexity reaches O(n2). Since tu and td represent the maximum and minimum values respectively in the data excluding outliers, we can use a larger portion of the data to calculate tu and a smaller portion to calculate td, which can significantly reduce computational complexity.
In mathematics, extreme values are defined as follows: If a function f(x) is defined in a neighborhood D of x0, and f(x)<f(x0) holds for all points in D, then f(x0) is called a local maximum of f(x). Similarly, if f(x)>f(x0) holds for all points in D, then f(x0) is called a local minimum of f(x).
Extreme values in a time series can be described similarly. In the time series X, if xi is greater than all values in its preceding interval and not less than all values in its subsequent interval, then xi is called a local maximum. Similarly, if xi is less than all values in its preceding interval and not greater than all values in its subsequent interval, it is called a local minimum.
Local maxima certainly correspond to the portion of the larger data and can be used to calculate tu, while local minima correspond to the portion of the smaller data and can be used to calculate td. The calculation methods are the same, but instead of previously using the entire X[-k]i to calculate tu and td, we now use the local maxima in X[-k]i to calculate tu, and the local minima in X[-k]i to calculate td.
The calculation of extreme values is straightforward:
Let:
Z=X[-k]i
Local maxima sequence Mav:
Mav=[zj, zj>max(Z[-l]j)&&zj≥max(Z[-l]j)]
Local minima sequence Miv:
Miv=[zj, zj<min(Z[-l]j)&&zj≤=min(Z[-l]j)]
where l is the interval length for extreme values calculation.
It should also be noted that when Z is a monotonically increasing, monotonically decreasing, or constant curve, local maxima and minima may not exist or may be too few to adequately represent the overall data. In such cases, using extreme values to calculate tu and td is not appropriate.
SPL routine:
| A | B | |
|---|---|---|
| 1 | =data=file(B1).import@tci().to(100) | |
| 2 | 1 | /l |
| 3 | =A1.len() | |
| 4 | =A1.select(#>A2&&#<=A3-A2&&~>~[-A2,-1].max()&&~>=~[1,A2].max()) | /Local maxima sequence Mav |
| 5 | =A1.select(#>A2&&#<=A3-A2&&~<~[-A2,-1].min()&&~<=~[1,A2].min()) | /Local minima sequence Miv |
Calculation result example:
Local maxima (bold points in the figure)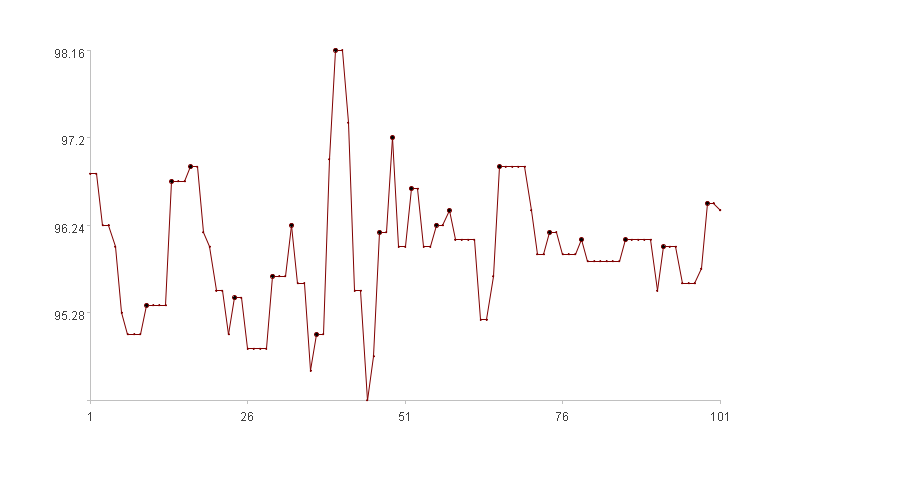
Local minima (bold points in the figure)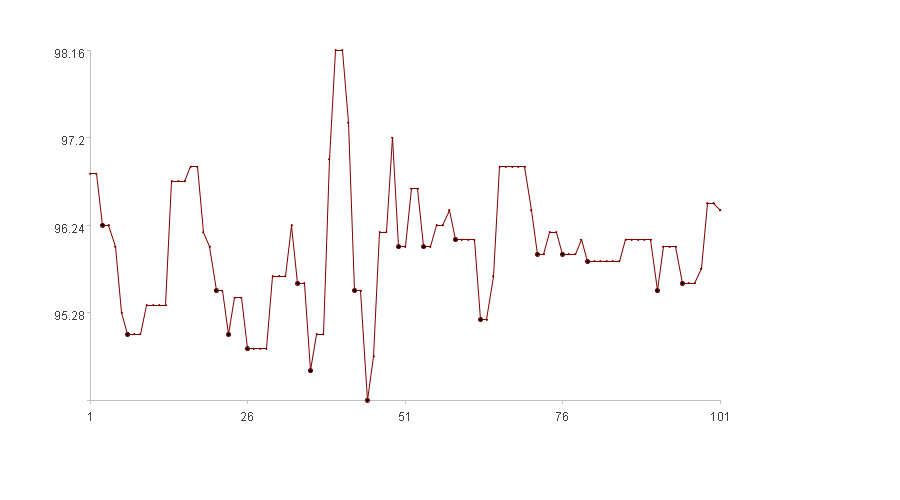
SPL Official Website 👉 https://www.esproc.com
SPL Feedback and Help 👉 https://www.reddit.com/r/esProcSPL
SPL Learning Material 👉 https://c.esproc.com
SPL Source Code and Package 👉 https://github.com/SPLWare/esProc
Discord 👉 https://discord.gg/sxd59A8F2W
Youtube 👉 https://www.youtube.com/@esProc_SPL

