

1.4 Distance method
Data points that are far from other points are considered uncommon. This method compares the sum of distances (absolute differences) between each data point and all others, and takes the smallest distance sum as a baseline. Points exceeding a certain multiple of this baseline are considered outliers.
Alternatively, by finding data points that are “not far” from other points, we can regard them as normal data. Data outside the range between the minimum and maximum values of the normal data is considered anomalous.
Select a threshold-mode anomaly function:
TA[tu,td](x)=max(x-tu, td-x,0)/(tu-td)
where tu and td are the upper and lower limits learned from X[-k]i.
The method to calculate tu and td using X[-k]i is as follows:
1. Calculate the sum of distances from each point in X[-k]i to all other points.
The sum of distances for the p-th point, xp, is denoted as dp:
dp=sum(|xp-xq|),xq∈X[-k]i
where xp and xq are the p-th and q-th points in X[-k]i, respectively. The sequence of distance sums is represented by D.
2. Denote the minimum distance sum as dmi:
dmi=min(D)
3. The sequence of xp values with a distance sum no greater than n times the minimum distance sum (n*dmi) is considered data points ‘not far’ from other points and is denoted as SX. Its minimum and maximum values are then used as the lower limit td and upper limit tu, respectively.
SX=[xp,dp≤n*dmi]
td= min(SX)
tu= max(SX)
The anomaly score od is calculated as follows:
od=max(Xi-tu, td-Xi,0)/(tu-td)
SPL routine:
| A | B | |
|---|---|---|
| 1 | =data=file(“1Ddata.csv”).import@tci().to(100) | |
| 2 | =n=2 | /Distance multiplier, n |
| 3 | =ldata=data.m(:100) | /Learning data X[-k]i (interval of 100) |
| 4 | =xi=data(101) | /Xi |
| 5 | =D=ldata.((v=,ldata.(abs(v-))).sum()) | /Sum of distances from each point to all other points, D |
| 6 | =dmi=D.min() | /Minimum distance sum, dmi |
| 7 | =D.pselect@a(~<=n*dmi) | /Indices with a distance sum less than n times the minimum distance sum |
| 8 | =SX=ldata(A7) | /Normal data SX |
| 9 | =td=SX.min() | /Lower limit td |
| 10 | =tu=SX.max() | /Upper limit tu |
| 11 | =od=max(xi-tu,td-xi,0)/(tu-td) | /Anomaly score od |
Adjusting n can adjust the values of tu and td. By default, n is set to 2.
Calculation result example:
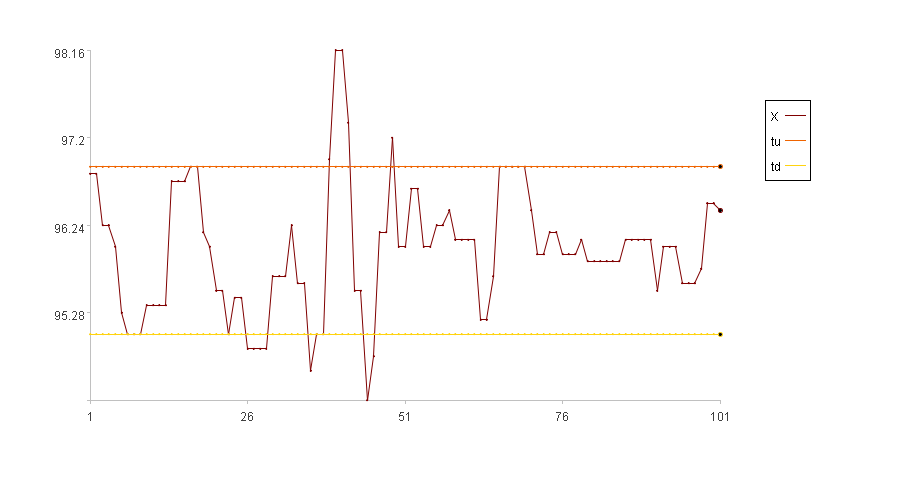
Since Xi falls between tu and td, the anomaly score is 0.
SPL Official Website 👉 https://www.esproc.com
SPL Feedback and Help 👉 https://www.reddit.com/r/esProcSPL
SPL Learning Material 👉 https://c.esproc.com
SPL Source Code and Package 👉 https://github.com/SPLWare/esProc
Discord 👉 https://discord.gg/sxd59A8F2W
Youtube 👉 https://www.youtube.com/@esProc_SPL

