

1.3 Normal statistical method
In a standard normal distribution, the range covered by three standard deviations (3σ, where σ represents one standard deviation) can encompass 99.7% of the data. Therefore, data points outside 3σ can be considered outliers.
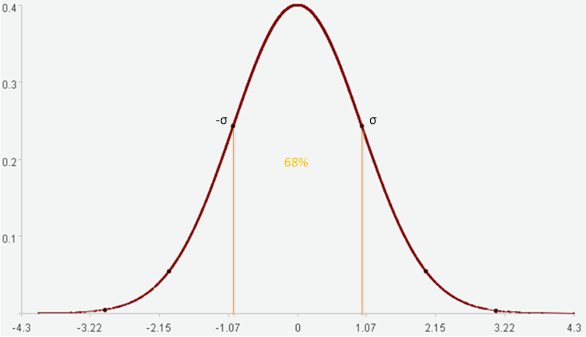
One standard deviation encompasses 68% of the data.
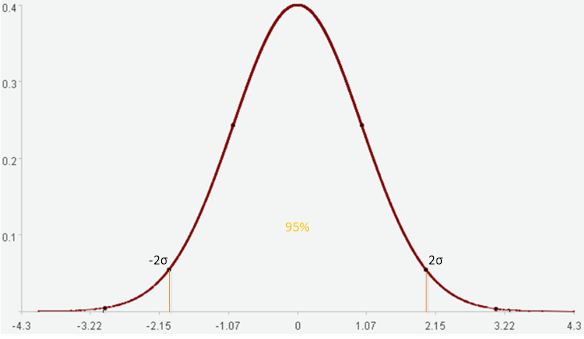
Two standard deviations encompass 95% of the data.
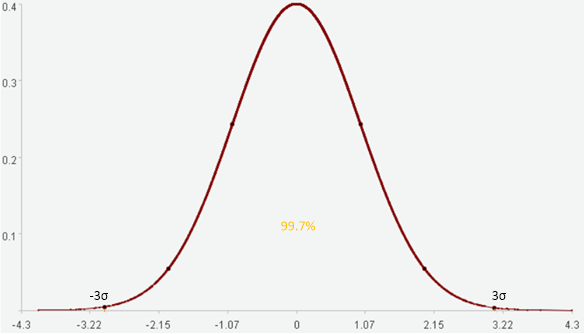
Three standard deviations encompass 99.7% of the data.
The characteristics of a normal distribution determine that the data points outside a range of n standard deviations are uncommon and can be considered anomalies.
Select a threshold-mode anomaly function:
TA[tu,td](x)=max(x-tu, td-x,0)/(tu-td)
The method to calculate tu and td using X[-k]i is as follows:
a=avg(X[-k]i)
σ=std(X[-k]i)
tu=a+n*σ
td=a-n*σ
Where, a is the average of X[-k]i, σ is the standard deviation of X[-k]i, and n is a multiple of the standard deviation. Modifying n can adjust the size of tu and td.
The anomaly score od is calculated as follows:
od=max(xi-tu, td-xi,0)/(tu-td)
SPL routine:
| A | B | |
|---|---|---|
| 1 | =data=file(“1Ddata.csv”).import@tci().to(100) | |
| 2 | =n=3 | /Multiple of standard deviation |
| 3 | =ldata=data.m(:100) | /Learning data X[-k]i (interval of 100) |
| 4 | =xi=data(101) | /xi |
| 5 | =a=A3.avg() | /Average a |
| 6 | =sigma=sqrt(var@s(A3)) | /Standard deviation σ |
| 7 | =td=a-n*sigma | /Lower limit td |
| 8 | =tu=a+n*sigma | /Upper limit tu |
| 9 | =od=max(xi-tu,td-xi,0)/(tu-td) | /Anomaly score od |
Adjusting n can adjust the values of tu and td. By default, n is set to 3.
Calculation result example:
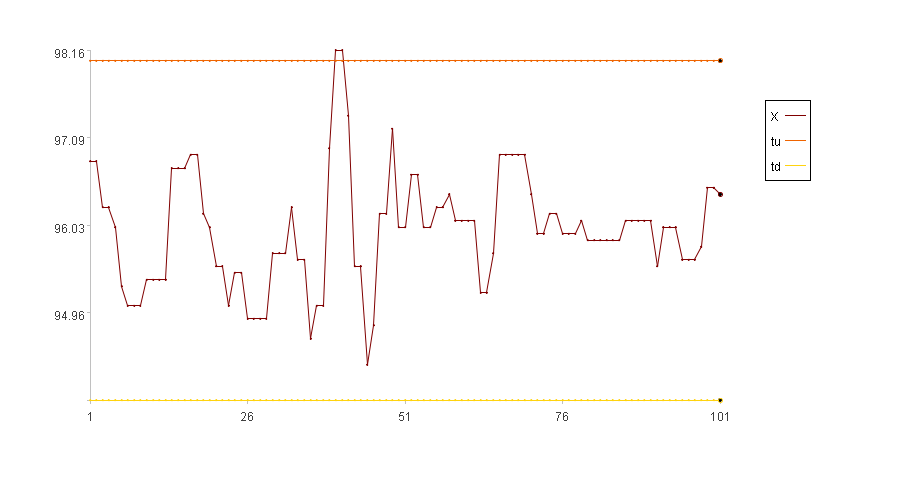
Since xi falls between tu and td, the anomaly score is 0.
SPL Official Website 👉 https://www.esproc.com
SPL Feedback and Help 👉 https://www.reddit.com/r/esProcSPL
SPL Learning Material 👉 https://c.esproc.com
SPL Source Code and Package 👉 https://github.com/SPLWare/esProc
Discord 👉 https://discord.gg/sxd59A8F2W
Youtube 👉 https://www.youtube.com/@esProc_SPL

