

1.2 Box plot method
A box plot is a statistical graph that visually represents the distribution of one or multiple sets of continuous quantitative data using five key values: the minimum observed value, the first quartile, the median, the third quartile, and the maximum observed value. It is named for its box-like shape.
Box plot components:
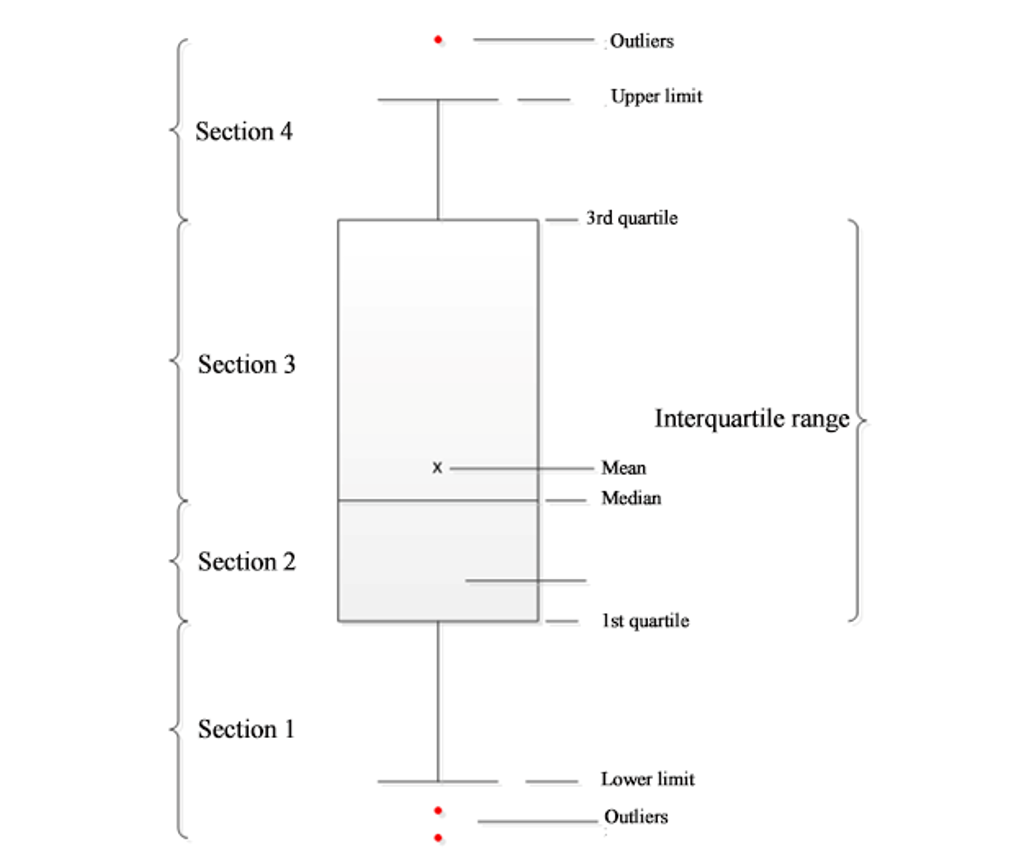
As the figure shows, most of the data is contained between the upper and lower limits, while a few data points lie outside these limits. These data points are uncommon and can be considered outliers.
Select a threshold-mode anomaly function:
TA[tu,td](x)=max(x-tu, td-x,0)/(tu-td)
The method to calculate tu and td using X[-k]i is as follows:
tu=Q3+n*IQR
td=Q1-n*IQR
where Q1 is the first quartile, Q3 is the third quartile, n is a multiple of the interquartile range; adjusting n can adjust the size of tu and td .
The anomaly score is represented by od and can be calculated as follows:
od=max(xi-tu, td-xi,0)/( tu-td)
SPL routine:
| A | B | |
|---|---|---|
| 1 | =data=file(“1Ddata.csv”).import@tci().to(100) | /Data |
| 2 | =n=1.5 | /Multiple of interquartile range |
| 3 | =ldata=data.m(:100) | /Learning data x[-k]i (interval of 100) |
| 4 | =xi=data(101) | /xi, the data point to be assessed for anomaly |
| 5 | =ldata.median(:4) | /Three quartiles |
| 6 | =Q1=A5(1) | /1st quartile Q1 |
| 7 | =Q3=A5(3) | /3rd quartile Q3 |
| 8 | =IQR=Q3-Q1 | /Interquartile range IQR |
| 9 | =td=Q1-n*IQR | /Lower limit td |
| 10 | =tu=Q3+n*IQR | /Upper limit tu |
| 11 | =rg=max(xi-tu,td-xi,0)/(tu-td) | /Anomaly score od |
import@i() returns a sequence when the data has only one column.
A.median(:k) divides the data into k equal segments and returns k-1 segment values. Adjusting n can adjust the values of tu and td . The value of n is typically between [1.5, 3].
Calculation result example:
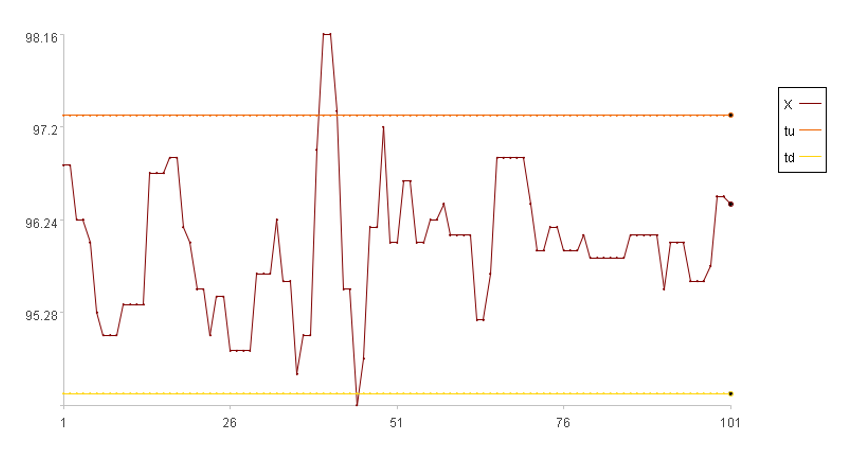
The X-axis represents the sequence index, and the Y-axis represents the sequence value. In the legend, X denotes the data values, tu is the upper threshold, and td is the lower threshold (Note: While tu and td are numerical values, they are plotted as lines for better visualization). Because the final, bolded data point, xi, falls between tu and td , its anomaly score is 0.
SPL Official Website 👉 https://www.esproc.com
SPL Feedback and Help 👉 https://www.reddit.com/r/esProcSPL
SPL Learning Material 👉 https://c.esproc.com
SPL Source Code and Package 👉 https://github.com/SPLWare/esProc
Discord 👉 https://discord.gg/sxd59A8F2W
Youtube 👉 https://www.youtube.com/@esProc_SPL

