

6. Precipitation data computation
Based on text file meteorolog.txt, which stores meteorological data, and according to daily average temperature TEMP, the maximum wind speed MXSP and precipitation PRCP, (1) list the first precipitation at each observation station; (2) find which stations haven’t the precipitation data and which ones have at least six consecutive rainy days; and (3) for each station and for a day when there is a 2 degrees increase in temperature, find the number of such days when it rains or snows in the next day and, for each such a day find the probability of rain or snow; and also under the same condition, find the number of days when the average wind speed in the next day is greater than the yearly average wind speed and the probability of its happening.
Expected result sets:
SPL code:
| A | |
|---|---|
| 1 | =T(“meteorolog.txt”,STATION,DATE,TEMP,PRCP,WDSP) |
| 2 | =A1.derive(TEMPDiff,RainTomorrow,WindyTomorrow) |
| 3 | =A2.group(STATION) |
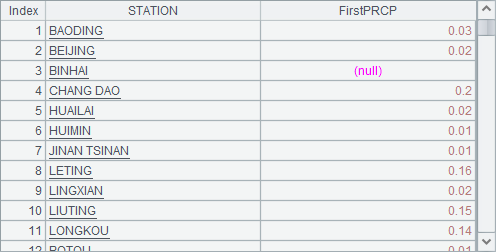
| 4 | =A3.new(STATION,~.ifn(PRCP):FirstPRCP) |
| 5 | =A3.select(!~.(PRCP).cor()).(STATION) |
| 6 | =A3.select(~.(PRCP[0,5].cand()).cor()).(STATION) |
| 7 | >A3.(avgWDSP=~.avg(WDSP), ~.run(TEMPDiff=if(#==1,0.0, round(TEMP-TEMP[-1],1)), RainTomorrow=PRCP[1]>0, WindyTomorrow=WDSP[1]>avgWDSP)) |
| 8 | =A3.(~.select(TEMPDiff<-2)) |
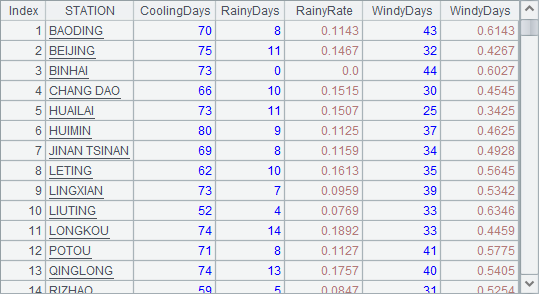
| 9 | =A8.new(STATION, ~.count():CoolingDays, ~.count(RainTomorrow):RainyDays, round(RainyDays/CoolingDays,4):RainyRate, ~.count(WindyTomorrow):WindyDays, round(WindyDays/CoolingDays,4):WindyDays) |
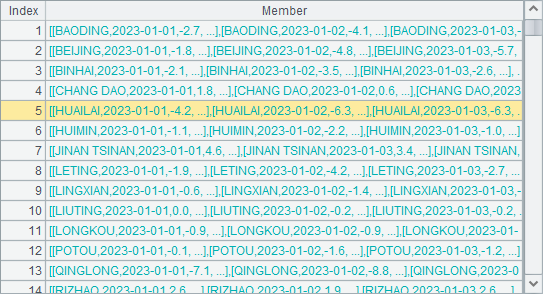
A1 reads data from the text file as a table sequence, during which only needed fields are retrieved. We can also modify the code as =file(“meteorolog.txt”).import@t(STATION,DATE,TEMP,PRCP,WDSP) and get the same result. A2 adds three new fields – TEMPDiff, RainTomorrow and WindyTomorrow to repectively store difference between temperature in each day and that of the previous day, whether it rains or snow in the next day, and whether it is windy in the next day. A3 groups A2’s table sequence having the newly added fields by observation station.
A4 uses A.new()function to generate data of the first precipitation at each observation station. Null is used when no data of the precipitation exists, so we just need to use A.ifn(x) function to get data of the first precipitation.
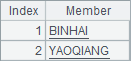
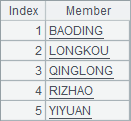
A5 uses A.cor(x) function to judge whether there is data of the first precipitation. The symbol ! is used at the beginning to get all observation stations that do not have precipitation during the whole year. In A6, [a,b] performs a cross-row operation to get a range and works with A.cand()function to find if it rains or snows in the continuous six days; then A.cor() function gets stations where it rains or snows for at least consecutive six days in the whole year.
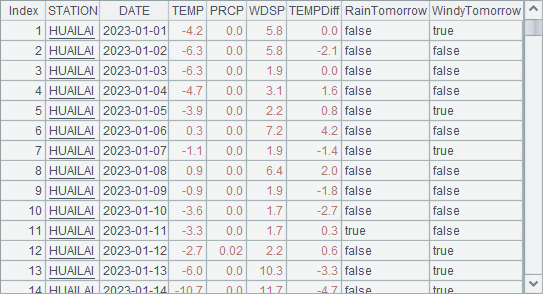
A7 loops through record of each station to perform the target computations. Expressions splited by the commas x1,x2,…xn are computed or executed in order and result of the last expression will be returned. For each station compute the yearly average wind speed and store the value in variable avgWDSP for use in the subsequent computations. Then A.run()function assigns values to new fields in order, during which brackets [] implement a cross-row computation, such as TEMP[-1], which is the temperature in the previous day, and PRCP[1] representing the precipitation in the next day, and the temperature difference in the first day is set as 0. After value assignment is finished, A7 gets the following result:
We can view detailed data in any group. Here are records of HUAILAI station:
A8 selects records where the temperature decreases by over 2 degrees for use in the later computation. Its result is a sequence consisting of record sequences, where a record sequence is a sequence made up of table sequence records. In A9, A.new()function generates the result table sequence, during which round() function is used to keep 4 decimal places for the ratio value.
7. Merge computation
Contents and Exercise Data
SPL Official Website 👉 https://www.esproc.com
SPL Feedback and Help 👉 https://www.reddit.com/r/esProcSPL
SPL Learning Material 👉 https://c.esproc.com
SPL Source Code and Package 👉 https://github.com/SPLWare/esProc
Discord 👉 https://discord.gg/sxd59A8F2W
Youtube 👉 https://www.youtube.com/@esProc_SPL


Chinese version