

7. Merge computation
6. Precipitation data computation
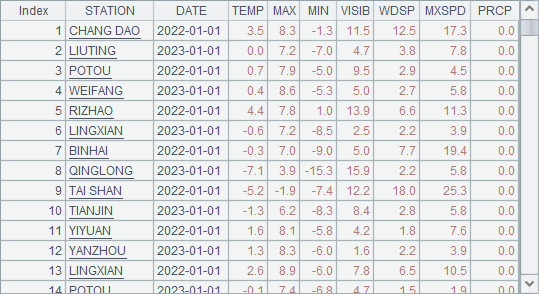
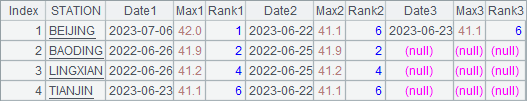
meteorolog.txt stores meteorological data of the year 2023 at certain observation stations. meteorolog2022.txt stores meteorological data of the year 2022 at these stations. (1) Get all meteorological data from the two years in turn according to the same month and date; (2) Find the stations where the total precipitation (PRCP) rank top 10 in both years; and (3) among data of the two years get records of 8 highest temperature points (including those sharing same ranking), list data of the same station in one row, and display the corresponding date, highest temperature and rank of the year in fields Date1,Max1,Rank1,Date2,Max2,Rank2,…
Expected results:
SPL code:
| A | |
|---|---|
| 1 | =T(“meteorolog2022.txt”) |
| 2 | =T(“meteorolog.txt”) |
| 3 | =[A1,A2].merge(month(DATE), day(DATE)) |
| 4 | =A1.groups(STATION;round(sum(PRCP),2):TOTALPRCP).top(-10,TOTALPRCP,~) |
| 5 | =A2.groups(STATION;round(sum(PRCP),2):TOTALPRCP).top(-10,TOTALPRCP,~) |
| 6 | =[A4,A5].merge@oi(STATION) |
| 7 | =A3.top@r(-8;MAX) |
| 8 | =A7.(MAX) |
| 9 | =A7.derive(rank@r(MAX,A8):Rank) |
| 10 | =A9.groupc(STATION;DATE,MAX,Rank;${8.([“Date”/~,“Max”/~,“Rank”/~].concat@c()).concat@c()}) |
A1 and A2 respectively retrieve data from the two files. As data of both years are arranged in the chronologial order, A3 merges two table sequences according to the month and date and then gets records of same month and date from both table sequences in turn.
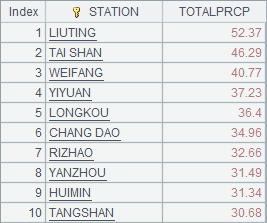
A4 and A5 respectively find stations where precipitation rank top 10 in the two years. Parameter -10 is used to get the top10 stations with the most precipitation. The syntax has the same effect as -TOTALPRCP. Below is A4’s result set:
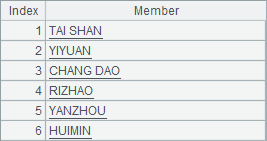
A6 merges result sets of A4 and A5, and works with @i option to compute intersection of STATION values. Since result sets of both A4 and A5 are ordered by precipitation instead of station, @o option is used to sort them before merging. To get a result sequence of stations, we can also first compute A4 and A5 and then perform intersection on their sequences. In that case A6’s expression will be =A4.(STATION)^A5.(STATION).
In A7, A.top() function gets records having the highest 8 temperature points. It needs to work with @r option to include records sharing same rankings. A8 gets the highest temperature values from A7 to compute rankings. A9 generates required data, including station names, date, highest temperature, based on A7’s records of the highest 8 temperatures, and computes their rankings. Below is A9’s result set, which includes more than 8 records because of some share the same ranking:
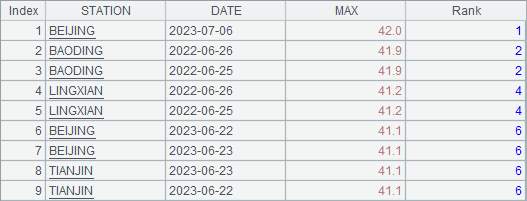
In A10, P.groupc(g,…;F,…;N,…) function performs row-to-column transposition over certain columns of A9’s result table sequence, groups records by STATION field, for each group lists DATE, MAX and Rank values in multiple column groups, and computes new field names with macro ${}. Here 8 groups of new field names (Daten, Maxn and Rankn) are specified, but as the above expected result set shows, the computation is based on the maximum number of column groups among the stations and extra new field names are not used.
8. Using cursor on large data sets
Contents and Exercise Data
SPL Official Website 👉 https://www.esproc.com
SPL Feedback and Help 👉 https://www.reddit.com/r/esProcSPL
SPL Learning Material 👉 https://c.esproc.com
SPL Source Code and Package 👉 https://github.com/SPLWare/esProc
Discord 👉 https://discord.gg/sxd59A8F2W
Youtube 👉 https://www.youtube.com/@esProc_SPL


Chinese version