

12.5 Use formulas to handle interval association
Here below is a data table:
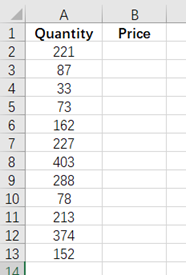
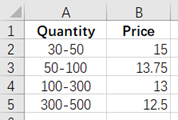
We want to calculate the price value in column B according to the quantity in column A, and the calculation should follow the rule: different quantity intervals correspond to different prices, as shown in the table below:
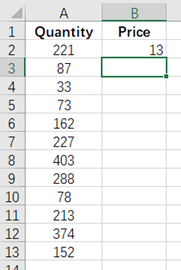
Enter in cell B2:
=spl("=[15,13.75,13,12.5]([30,50,100,300,500].pseg@r(?1))",A2)
Then drag B2 down to every relevant row:
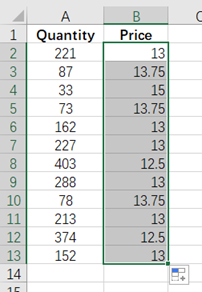
The idea of the calculation is to use the pseg function to calculate which interval the quantity value belongs to [30, 50, 100, 300, 500], and then take out the price of the corresponding interval from the price sequence [15, 13.75, 13, 12.5] and return.
esProc Desktop and Excel Processing
12.4 Reference multi-column data from association table
12.6 Use association table to handle interval association
SPL Official Website 👉 https://www.esproc.com
SPL Feedback and Help 👉 https://www.reddit.com/r/esProc_Desktop/
SPL Learning Material 👉 https://c.esproc.com
Discord 👉 https://discord.gg/sxd59A8F2W
Youtube 👉 https://www.youtube.com/@esProcDesktop
Linkedin Group 👉 https://www.linkedin.com/groups/14419406/

