

Find the Longest Consecutive Rising Streak of a Single Stock
Problem Description
The table stock records the daily closing prices of many stocks, with the fields CODE (stock code), DT (trading date) and CL (closing price). For a given stock (100046 in this example), find the number of days in its longest consecutive rising period. A consecutive rise here means the closing price does not fall back from one day to the next.
Source Data
The source table is large, so only part of the records are listed below:
CODE |
DT |
CL |
100046 |
2009-01-01 00:00:00 |
3.89 |
100046 |
2009-01-02 00:00:00 |
3.93 |
100046 |
2009-01-05 00:00:00 |
3.78 |
100046 |
2009-01-06 00:00:00 |
4.04 |
100046 |
2009-01-07 00:00:00 |
3.77 |
100046 |
2009-01-08 00:00:00 |
4.02 |
100046 |
2009-01-09 00:00:00 |
4.42 |
100046 |
2009-01-12 00:00:00 |
4.86 |
100046 |
2009-01-13 00:00:00 |
4.44 |
100046 |
2009-01-14 00:00:00 |
4.88 |
100046 |
2009-01-15 00:00:00 |
4.98 |
100046 |
2009-01-16 00:00:00 |
4.99 |
100046 |
2009-01-19 00:00:00 |
4.83 |
100046 |
2009-01-20 00:00:00 |
5.12 |
100046 |
2009-01-21 00:00:00 |
5.51 |
100046 |
2009-01-22 00:00:00 |
5.42 |
100046 |
2009-01-23 00:00:00 |
5.45 |
100046 |
2009-01-26 00:00:00 |
5.39 |
100046 |
2009-01-27 00:00:00 |
5.26 |
100046 |
2009-01-28 00:00:00 |
5.60 |
100046 |
2009-01-29 00:00:00 |
5.11 |
100046 |
2009-01-30 00:00:00 |
5.26 |
Expected Result
Only one value, the maximum number of consecutive rising days: 4
On 01-02 the closing price rose from 3.89 to 3.93, a consecutive rise; on 01-05 it fell from 3.93 to 3.78, which breaks the rise, and a new rising run starts from there.
The longest run is 2009-01-07 to 2009-01-12: its starting point 01-07 closed at 3.77, below the 4.04 of 01-06, and then 4.02, 4.42 and 4.86 climbed steadily, four days without a fallback. Another run from 2009-01-13 to 2009-01-16 is also 4 days (4.44, 4.88, 4.98, 4.99) and ties with it for the longest.
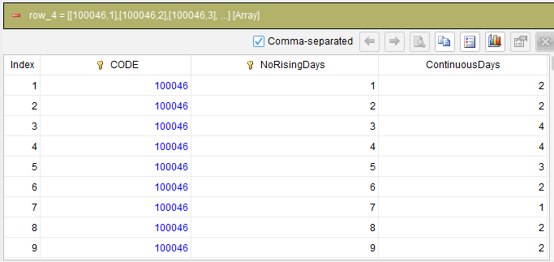
The stock is split into 9 runs with lengths 2, 2, 4, 4, 3, 2, 1, 2 and 2. The longest is 4 days and two runs tie for it, so the answer is 4.
SQLazy Step-by-Step Implementation
A consecutive rise is essentially a run of days without a fallback. Sort the target stock by date first, then use the segment action to watch the closing price: as soon as the closing price falls back to the previous day level or below, the previous rise has ended, the group number increments and a new run starts. Every record then carries the number of the rising run it belongs to. Next, count the rows by run number, and that count is the number of consecutive rising days in the run; finally take a maximum without grouping, which gives the longest consecutive rising streak of the stock.
[Click to run this example online]
The steps are explained below.
Name |
Anchor |
Statement |
stock |
filter CODE = 100046 |
|
sort DT asc |
||
segment condition (CL <= CL[-1]); not_up; partition CODE; as NoRisingDays |
||
summarize count DT as ContinuousDays; group CODE, NoRisingDays |
||
summarize max ContinuousDays as max_ContinuousDays |
Step 1: Take the target stock
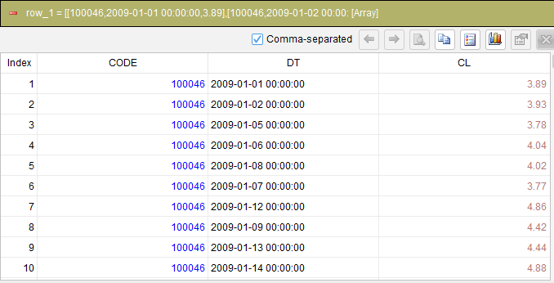
filter CODE = 100046
Filter the stock table for the records whose CODE equals 100046; the rest of the calculation works on this stock only. The comparison uses the symbol "=".
Step 2: Sort by date in ascending order
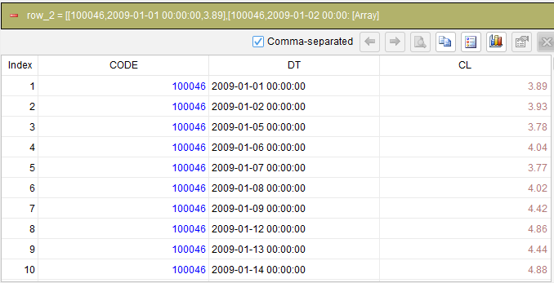
sort DT asc
Segmentation walks through the records in order, and if the order is wrong the runs it produces are meaningless, so sort by trading date ascending first.
Step 3: Start a new run when the closing price stops rising
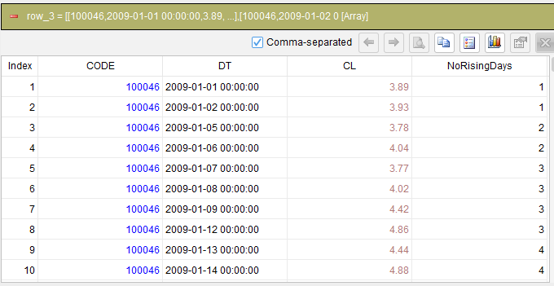
segment condition (CL <= CL[-1]); not_up; partition CODE; as NoRisingDays
This is the core step of the problem. The segment action tests the condition CL <= CL[-1]: when the current closing price is not higher than the previous day the group number increments, and when it is higher the group number stays the same. CL[-1] is the relative position syntax, which takes the row before the current one, so the previous day price is available without writing a self-join. The generated group numbers are written into the new column NoRisingDays, and records with the same group number form one consecutive rising run.
partition CODE lets every stock be segmented on its own without interference; the data has already been filtered down to one stock here, so this partition follows the original solution and saves a code change if the calculation is later opened up to several stocks.
Step 4: Count how many days each run has
summarize count DT as ContinuousDays; group CODE, NoRisingDays
Group by CODE and NoRisingDays, count the records in each group, write the aggregation count before the aggregated item DT and name the result ContinuousDays. This step compresses the long record-level table into a short run-level table with one row per run.
Step 5: Take the longest run
summarize max ContinuousDays as max_ContinuousDays
Every row is now the length of one run and the problem asks only for the maximum, so no grouping is written and the whole table is treated as a single group; that gives the maximum number of consecutive rising days directly. Without a group the result is a single row and can be used as a single value afterwards.

Generated SQL
After confirming the logic of the above 5 steps, the SQLazy compiler automatically generates native SQL (MySQL syntax used here):
WITH Value_2 AS (
    SELECT CODE, DT, CL
    FROM stock
    WHERE CODE = 100046
  )
SELECT MAX(ContinuousDays) AS max_ContinuousDays
FROM (
  SELECT CODE, NoRisingDays, COUNT(DT) AS ContinuousDays
  FROM (
    SELECT CODE, DT, CL
      , 1 + SUM(CASE
        WHEN (CL <= col__2) THEN 1
        ELSE 0
      END) OVER (PARTITION BY CODE ORDER BY CASE
        WHEN DT IS NULL THEN 1
        ELSE 0
      END, DT ASC ROWS UNBOUNDED PRECEDING) AS NoRisingDays
    FROM (
      SELECT Value_2.*, LAG(CL) OVER (PARTITION BY CODE ORDER BY CASE
          WHEN DT IS NULL THEN 1
          ELSE 0
        END, DT ASC) AS col__2
      FROM Value_2
    ) sub__3
  ) t_4
  GROUP BY CODE, NoRisingDays
) t_5
SQLazy lets you describe logic in business language instead of writing nested SQL queries. What is called a "consecutive rise" is essentially a run of days in which the price does not fall back. SQLazy expresses this business judgment with one segment statement, whereas hand-written SQL has to build the previous day price first, accumulate the run number, count per run and finally take the maximum, four levels of nesting before it yields a single number.
The test inside the segment action is written as a condition expression, and the condition may contain relative positions (the previous day price) as well as aggregate calculations, so there is no need to assemble window functions or join the table to itself before comparing. In SQL the same thing has to be wrapped in nested subqueries, and the reader has to recognise the LAG plus SUM plus GROUP BY combination before seeing that the statement is doing "segment and count".
Step-by-step calculation is the core advantage here. Fetching, sorting, segmenting, counting and taking the maximum each occupy one statement, and every step can be inspected on its own: after step 3 you can see the run table with one row per run and which run is the longest at a glance, after step 4 you can see the length of each run, and only step 5 collapses it into a single value. Verifying the same intermediate results in SQL means splitting the statement apart and running it again, and when something goes wrong it is hard to tell which level is at fault.
Computing records first and values second is a common SQLazy pattern: segmentation groups the records, the summary squeezes each group into one row, and a final ungrouped maximum reduces that to a single value. The grain grows coarser step by step, which matches the way people analyse data.
Official Links
SQLazy Online Experience: sqlazy.com (free, no registration required)
SQLazy Repository: github.com/SPLWare/SQLazy
SPL Official Website 👉 https://www.esproc.com
SPL Feedback and Help 👉 https://www.reddit.com/r/esProcSPL
SPL Learning Material 👉 https://c.esproc.com
SPL Source Code and Package 👉 https://github.com/SPLWare/esProc
Discord 👉 https://discord.gg/sxd59A8F2W
Youtube 👉 https://www.youtube.com/@esProc_SPL


Chinese Version https://c.raqsoft.com.cn/article/1794395615324