

5.7 Discovering unstable segments
In a time series, a period with minimal data variation is referred to as a stable segment. Conversely, a period with rapid data rise or fall is called an unstable segment. An unstable segment typically marks the end of a preceding stable segment and the beginning of a subsequent stable segment. Discovering unstable segments allows us to determine the start and end times of each stable segment. This falls under the category of shape discovery problems but is relatively simpler. It simply requires identifying features that distinguish stable segments from unstable segments and then applying an anomaly detection model.
Model attempt
The figure below shows a time series with multiple transitions between two stable segments, where the red-boxed periods represent unstable segments:
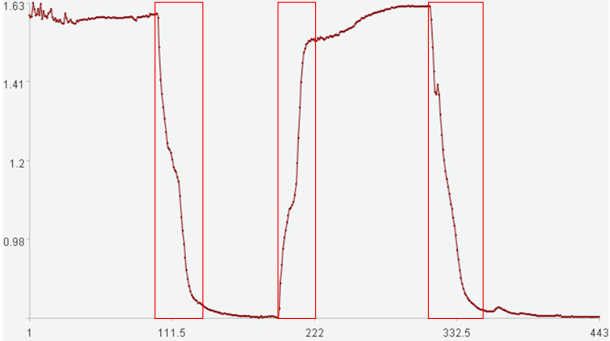
The x-axis represents the time series index, and the y-axis represents the time series values.
Unstable segments lie between stable segments. Because directly using the original values makes it difficult to accurately identify the start and end times of unstable segments, we use a derived time series instead. The rate of change within stable segments is small, while the rate of change within unstable segments is large. Therefore, the rate of change is used for this task.
Assuming the time series is X:
X= [x1,x2,…,xn]
Rate of change C:
C=Fc(X)
Where Fc(…) is the rate-of-change function.
Anomaly score O:
O=E(C,arg1,arg2,…)
Where E(…) is the anomaly detection function, and arg1, arg2, … are the parameters required for anomaly detection.
SPL routine:
| A | B | |
|---|---|---|
| 1 | =file(C1).import@tci() | /X |
| 2 | 30 | /Learning interval k |
| 3 | 5 | /Calculating threshold parameter (radius multiplier) using distance method |
| 4 | =A1.((if(#==1,~[1]-~,~-~[-1]))) | /Rate of change C |
| 5 | =A4.(if(#<=A2,null,threshold(~[-A2:-1],“up”,A3))) | /Upper threshold U |
| 6 | =A4.(if(#<=A2,null,threshold(~[-A2:-1],“down”,A3))) | /Lower threshold D |
| 7 | =A4.(if(#<=A2,null,max(~-A5(#),A6(#)-~,0)/(A5(#)-A6(#)))) | /Anomaly score O |
threshold(…) is the threshold calculation function. Here, the threshold is calculated using the distance method.
Calculation result example:
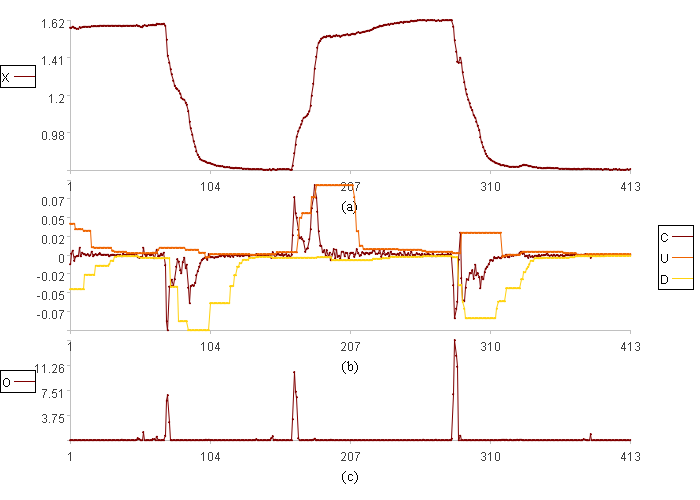
Figure (a) shows the time series X, Figure (b) shows the rate of change C along with its upper threshold U and lower threshold D, and Figure (c) shows the anomaly score O. Because the learning length is 30, the anomaly score cannot be calculated, so this figure has 30 fewer data points than the original value figure.
Model optimization
The model attempt was not entirely successful; it only detected the start time of the unstable segments, and the anomaly scores did not persist until the end of the unstable segments. However, the derived rate-of-change series proved effective, clearly distinguishing between stable and unstable segments. The problem is that the rate of change of the unstable segments was continuously used in calculating the upper and lower thresholds. This caused the thresholds to shift, negatively impacting the assessment of subsequent rates of change. To avoid this, we can consider excluding the current rate of change from the learning data if it is excessively large or small. This will prevent the upper and lower thresholds from shifting due to extreme rates of change, thereby accurately detecting unstable segments. Moreover, the learning data should include the current rate of change, giving the upper and lower thresholds the opportunity to adapt to the current rate, thereby reducing misjudgments.
The model is optimized as follows:
Stable segments exhibit very small rates of change, typically not exceeding a certain value. We set a threshold for the rate of change in a stable segment (e.g., 0.01), called the stability threshold, denoted as c0.
If the absolute value of the rate of change is greater than or equal to the stability threshold, that rate is not added to the learning data, and the previous upper and lower thresholds are maintained. If the absolute value of the rate of change is less than the stability threshold, the learning data is updated normally, and so are the upper and lower thresholds.
SPL routine:
| A | B | C | D | |
|---|---|---|---|---|
| 1 | =file(C1).import@tci() | /X | ||
| 2 | 30 | /Learning interval k | ||
| 3 | 5 | /Calculating threshold parameter (radius multiplier) using distance method | ||
| 4 | 0.01 | /Stable segment change rate threshold c0 | ||
| 5 | =A1.((if(#==1,~[1]-~,~-~[-1]))) | /Rate of change C | ||
| 6 | =U=[] | /Upper threshold U | ||
| 7 | =D=[] | /Lower threshold D | ||
| 8 | =O=[] | /Anomaly score O | ||
| 9 | for A5 | if #A9<=A2 | next | |
| 10 | else if #A9==A2+1 | =to(1,A2) | ||
| 11 | =ldata=A5(C10) | /Initial learning data | ||
| 12 | else if abs(A9)<A4 | =ldata.insert(0,A9).delete(1) | /Update learning data if less than c0 | |
| 13 | =tu=threshold(ldata,“up”,A3) | /tu | ||
| 14 | =td=threshold(ldata,“down”,A3) | /td | ||
| 15 | =od=max(A9-tu,td-A9,0)/(tu-td) | /od | ||
| 16 | =U.insert(0,tu) | |||
| 17 | =D.insert(0,td) | |||
| 18 | =O.insert(0,od) | |||
| 19 | =U | /Upper threshold U | ||
| 20 | =D | /Lower threshold D | ||
| 21 | =O | /Anomaly score O | ||
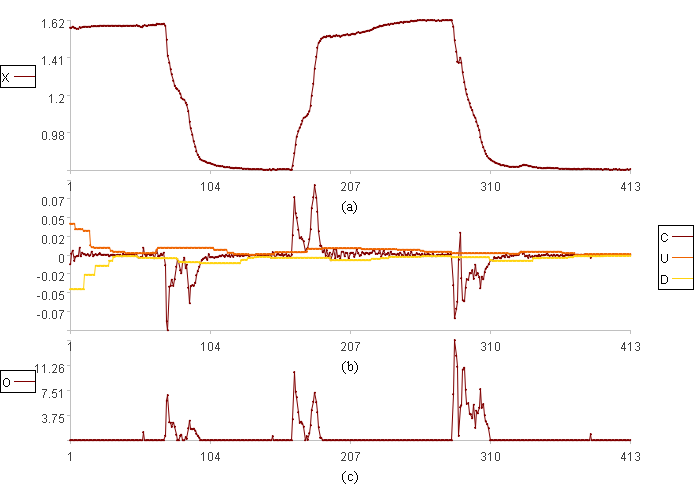
Calculation result example:
Model refinement
After model optimization, unstable segments are generally identified when the anomaly score exceeds 0. However, some minor anomalies persist within stable segments, and portions of unstable segments still go undetected. This is because some stable segments exhibit relatively large rates of change, while some unstable segments exhibit smaller rates of change. To improve accuracy, we can smooth the original values by calculating a main line. The main line has smaller rates of change in the stable segments, and the occasional changes in the unstable segments will also be smoothed out, making it easier to accurately detect the unstable segments.
Model refinement:
Calculate the main line M:
M=fit_main(X,k’)
Where fit_main(…) is the least-squares fitting function for the main line, and k’ is the balancing coefficient used during fitting.
SPL routine:
| A | B | C | D | |
|---|---|---|---|---|
| 1 | =file(C1).import@tci() | /X | ||
| 2 | 5 | /Main line interval | ||
| 3 | 5 | /Main line balancing coefficient k’ | ||
| 4 | 30 | /Learning interval k | ||
| 5 | 5 | /Calculating threshold parameter (radius multiplier) using distance method | ||
| 6 | 0.01 | /Stable segment change rate threshold c0 | ||
| 7 | =A1.(if(#<=A2,null,fit_main(~[-A2:0],A2)(A2+1))) | /Main line M | ||
| 8 | =A7.((if(#<=A2,,~-~[-1]))) | /Main line change rate C | ||
| 9 | =U=[] | /Upper threshold U | ||
| 10 | =D=[] | /Lower threshold D | ||
| 11 | =O=[] | /Anomaly score O | ||
| 12 | for A8 | if #A12<=A4 | next | |
| 13 | else if #A12==A4+1 | =to(1,A4) | ||
| 14 | =ldata=A8(C13) | /Initial learning data | ||
| 15 | else if abs(A12)<A6 | =ldata.insert(0,A12).delete(1) | /Update learning data if less than c0 | |
| 16 | =tu=threshold(ldata,“up”,A5) | /tu | ||
| 17 | =td=threshold(ldata,“down”,A5) | /td | ||
| 18 | =od=max(A12-tu,td-A12,0)/(tu-td) | /od | ||
| 19 | =U.insert(0,tu) | |||
| 20 | =D.insert(0,td) | |||
| 21 | =O.insert(0,od) | |||
| 22 | =U | /Upper threshold U | ||
| 23 | =D | /Lower threshold D | ||
| 24 | =O | /Anomaly score O | ||
Calculation result example:
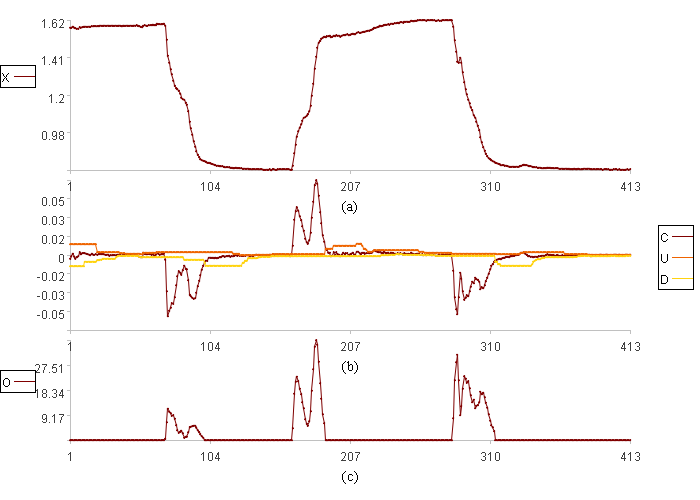
After model refinement, the unstable segments can be accurately detected.
This routine is presented as a case study to illustrate a simple approach to shape discovery. However, model optimization and refinement are not always so straightforward and often involve complex processes. In fact, the model could be further optimized by incorporating derived features from stable and unstable segments as auxiliary observations. For example, fluctuation frequency is higher in stable segments and lower in unstable segments, which could further improve the accuracy of unstable segment detection.
Continuously optimizing models based on the industrial environment and process knowledge is a craft. Only by honing one’s craft can industrial production efficiency and production safety be truly improved.
SPL Official Website 👉 https://www.esproc.com
SPL Feedback and Help 👉 https://www.reddit.com/r/esProcSPL
SPL Learning Material 👉 https://c.esproc.com
SPL Source Code and Package 👉 https://github.com/SPLWare/esProc
Discord 👉 https://discord.gg/sxd59A8F2W
Youtube 👉 https://www.youtube.com/@esProc_SPL

