

5.3 Inverse standardization of parameters
Given a time series X, calculate the relevant feature indices and form a sequence table T:
| X | f(1) | f(2) | … |
|---|---|---|---|
| x1 | f(1)1 | f(2)1 | … |
| x2 | f(1)2 | f(2)2 | … |
| … | … | … | … |
| xn | f(1)n | f(2)n | … |
In principle, filtering T for feature indices that meet the conditions allows identification of curve segments Sp with the specified shape.
Sp=T.select(a(1)≤f(1)≤b(1), a(2)1≤f(2)≤b(2) ,…)
Where f(i) is the i-th feature index, and a(i) and b(i) are parameters defining the selection criteria for the i-th feature index.
Theoretically, feature indices can characterize the shape of curves, and combining them allows for filtering to identify specific shapes. However, several issues arise in practical application:
1. For different time series, even the same feature index may have different units of measurement.
For example:
X=[2,3,1,4,5,…]
Y=[2000,3000,1000,4000,5000,…]
Taking the rise-fall index as an example, the rise-fall index calculated from X is basically a single-digit number, while the rise-fall index calculated from Y is basically a four-digit number.
2. For the same time series, different feature indices may also have different units of measurement.
For example:
Y=[2000,3000,1000,4000,5000,…]
The rise-fall index calculated from Y is a four-digit number, whereas the oscillation frequency index is likely not.
Because of these issues, setting a(i) and b(i) becomes challenging. The parameter settings vary for each time series, each feature, and even each time period. Since the parameters are difficult to set, it becomes impossible to discover the specified shapes.
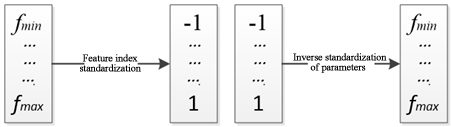
Standardization involves a linear transformation of the feature indices, projecting them into a fixed interval. Rather than altering the feature indices, we only need to apply an inverse transformation to the filtering parameters. Specifically, we fix the parameters within a simple interval (such as [0,1] or [-1,1]), inversely project these parameters onto each feature index, and ultimately filter the shapes based on the resulting projected parameters. The most commonly used simple interval is [0,1], but considering the characteristics of some feature indices, such as the rise-fall index (where negative numbers indicate a decrease, positive numbers indicate an increase, and 0 itself has a special meaning of no change), using the interval [0,1] would increase the amount of calculation. The interval [-1,1] is more suitable as a parameter interval.
Some feature indices have special meanings for 0 (such as the rise-fall index), requiring segment-wise projection. That is, the minimum value corresponds to -1, the maximum value corresponds to 1, and 0 corresponds to 0. Negative and positive values are linearly transformed separately. For some features with only positive values (such as the amplitude index), a simple linear projection can be used: 1 corresponds to the maximum value, -1 to the minimum value, and the remaining values undergo linear transformation.
Feature indices with special meanings for 0 (such as the rise-fall index) are projected as follows:
Assume that the maximum value of the feature index is fmax, and the minimum value is fmin. Project [fmin,0] to [-1, 0] and [0,fmax] to [0, 1]. The functional relationship between the feature index f and the selection parameter a is:
F(a)=if(a=0,0,if(a<0,-fmin*a,fmax*a)),a∈[-1,1]
Feature indices that only have positive numbers (such as the amplitude index) are projected as follows:
F(a)=(fmax-fmin)*a/2+(fmax+fmin)/2,a∈[-1,1]
SPL Official Website 👉 https://www.esproc.com
SPL Feedback and Help 👉 https://www.reddit.com/r/esProcSPL
SPL Learning Material 👉 https://c.esproc.com
SPL Source Code and Package 👉 https://github.com/SPLWare/esProc
Discord 👉 https://discord.gg/sxd59A8F2W
Youtube 👉 https://www.youtube.com/@esProc_SPL

