

2.2 Rate of change
Rate of change is a derived series that describes the speed at which the original values change.
In simple terms, the rate of change can be simply represented by the difference of original time series values within a unit time period. The rate of change, C, can be calculated as follows:
ci=(xi-xi-l)/l
When l=1, the rate of change becomes the difference sequence of the original values. This method can also be referred to as the ‘differencing method’.
The differencing method uses only the values at the interval’s endpoints, neglecting the values in between. As a result, this method cannot accurately describe the behavior of the entire interval. Alternatively, we can define the rate of change using least-squares fitting, enabling a more comprehensive description of the interval. Specifically, we perform simple linear regression on X[-(l+1)]i+1 and take the slope of the resulting regression line as the rate of change of xi.
ci=(n*sum(j*xj)-sum(j)*sum(xj))/(n*sum(j2)-sum(j)2),j∈[1,n]
Where, n=l+1, which is the length of X[-(l+1)]i+1, and xj is the j-th element of X[-(l+1)]i+1.
SPL routine:
| A | B | C | |
|---|---|---|---|
| 1 | =data=file(“1Ddata.csv”).import@tci().to(100) | /Time series X | |
| 2 | =l=5 | /Interval l | |
| 3 | =data.((if(#<=l,null,(s=~[-l:0],func(A4,s))))) | /Rate of change C | |
| 4 | func | /Method for calculating rate of change ci | |
| 5 | =n=A4.len() | /n | |
| 6 | =n*A4.sum((j=#,xj=~,j*xj)) | /n*sum(j*xj) | |
| 7 | =A4.sum((j=#,j))*A4.sum((xj=~,xj)) | /sum(j)*sum(xj) | |
| 8 | =n*A4.sum((j=#,j*j)) | /n*sum(j2) | |
| 9 | =m=A4.sum((j=#,j)),m*m | /sum(j)2 | |
The rate of change C is calculated in Cell A3. Since l=5, each of the first 5 elements of X lacks the conditions to calculate this rate and is therefore assigned a null value. For the remaining xi values, ci is calculated using the fitting method.
The code block in A4 is the calculation process for linear regression.
Calculation result example:
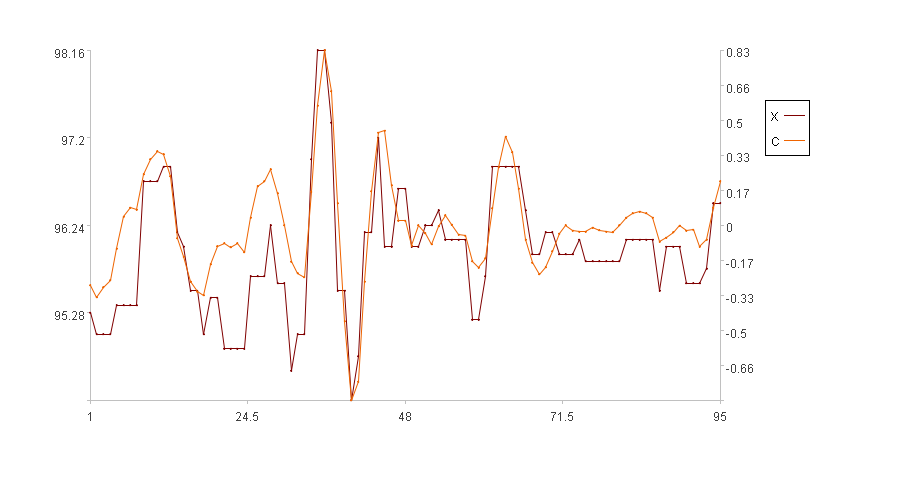
In the figure, the x-axis represents the sequence index, the left y-axis represents the values of the original series X, and the right y-axis represents the values of the rate of change C. In the legend, X is the original series and C is the rate of change. (Because the first five time points have no rate of change, the figure only displays the rate of change for the subsequent 95 time points).
SPL Official Website 👉 https://www.esproc.com
SPL Feedback and Help 👉 https://www.reddit.com/r/esProcSPL
SPL Learning Material 👉 https://c.esproc.com
SPL Source Code and Package 👉 https://github.com/SPLWare/esProc
Discord 👉 https://discord.gg/sxd59A8F2W
Youtube 👉 https://www.youtube.com/@esProc_SPL

