

22. The simple use of graph plotting
21. Computing PI to 10000 decimal places
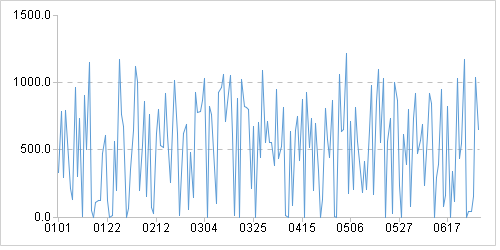
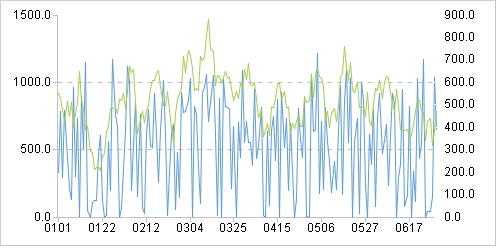
saleAmount.txt stores sales data of a retail store during a certain period of time. Plot a sales data line graph according to the store’s business performance, and a double line graph that compares the performance with average sales in every seven days.
Expected results:
SPL code:
| A | |
|---|---|
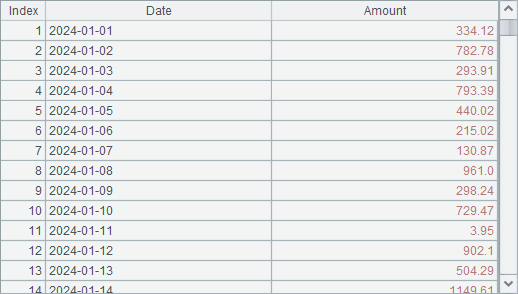
| 1 | =T(“saleAmount.txt”) |
| 2 | =canvas() |
| 3 | =A2.plot(“GraphLine”,“categories”:A1.(string(Date,“MMdd”)),“values”:A1.(Amount), “xLabelInterval”:20,“legendLocation”:5) |
| 4 | =A2.draw@p(500 ,250) |
| 5 | =A1.derive(round(Amount[-3,3].avg(), 2):movAvg) |
| 6 | =A1.new(Date,“Normal”:Type,Amount) |
| 7 | >A5.(A6.insert(0,A5.~.Date, “Moving”, movAvg)) |
| 8 | =canvas() |
| 9 | =A8.plot(“Graph2Axis”,“categories”:A6.(string(Date,“MMdd”)+“,”+Type), “values”:A6.(Amount),“type”:20,“xLabelInterval”:20,“legendLocation”:5) |
| 10 | =A8.draw@p(500 ,250) |
A1 reads data from the file:
A2 uses canvas() function to create a new canvas. A3 edits the plotting properties – select line graph under graph templates and set categories and values:
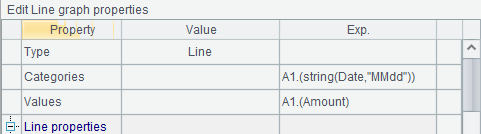
As there are a lot of categories in the plotting data, category label interval (Interval) property is set as 20. After the code is executed, select A4 and click “Browse Graphics” button on the right-top to view the plotting result. The graph shows that the sales data has drastic ups and downs.
A5 adds a moving average (movAvg) field to A1’s table. Its value is the average of data from 3 days before to 3 days after. A6 prepares data to plot the double line graph. It adds a data type (Type) field, whose original value is Normal. A7 inserts moving average values to A6 iteratively while defining their type as Moving. A8 creates a new canvas. A9 plots the dual-axis graph. Difference is that the category value should include both date data and type data separated by comma.

Execute A10 to draw the graph. Then we can view the plotting result. In the result graph, the two lines are displayed in different colors. The moving average line graph is smoother, and displays the sales changes more clearly.
23. Random mental arithmetic questions and auto paper-marking
Contents and Exercise Data
SPL Official Website 👉 https://www.esproc.com
SPL Feedback and Help 👉 https://www.reddit.com/r/esProcSPL
SPL Learning Material 👉 https://c.esproc.com
SPL Source Code and Package 👉 https://github.com/SPLWare/esProc
Discord 👉 https://discord.gg/sxd59A8F2W
Youtube 👉 https://www.youtube.com/@esProc_SPL


Chinese version