

11. Cumulative count of continuous values
meteorolog.txt stores meteorological data. Based on it find the largest counts of days of continuous average temperature (TEMP) increase and decrease in the whole year for each obvservation station.
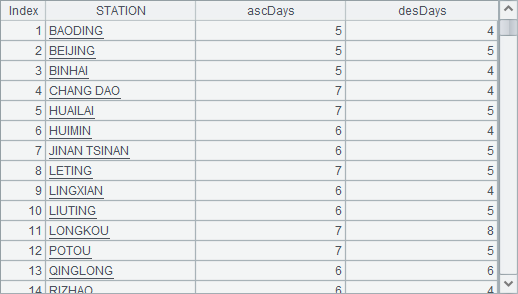
Expected result:
SPL code:
| A | |
|---|---|
| 1 | =T(“meteorolog.txt”,STATION,DATE,TEMP) |
| 2 | =A1.derive(ascDays, desDays) |
| 3 | =A2.group(STATION) |
| 4 | >A3.(~.(if(TEMP>TEMP[-1]: (ascDays=ascDays[-1]+1,desDays=0), TEMP<TEMP[-1]: (ascDays=0, desDays=desDays[-1]+1); (ascDays=0, desDays=0)))) |
| 5 | =A3.new(STATION,~.max(ascDays):ascDays,~.max(desDays):desDays) |
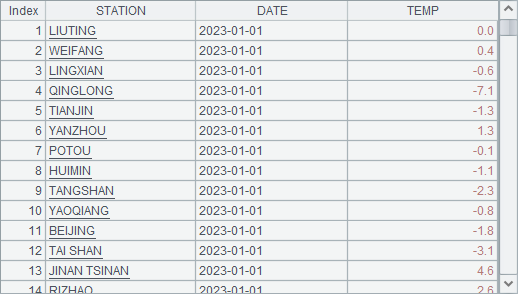
A1 retreives certain fields from the data file:
A2 adds new fields ascDays and desDays to A1’s table to record the cumulative counts of days of continuous temperature increase and decrease respectively as of each day. A3 groups A2’s result set by station.
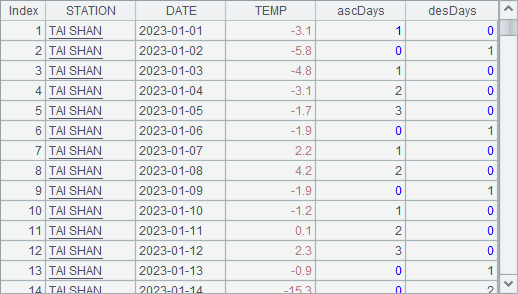
A4 loops records of each group to assign values to ascDays field and desDays field. If temperature increases on the current day, add 1 to ascDays value and reset desDays value to 0; if temperature decreases, reset ascDays value to 0 and add 1 to desDays value; and if temperature does not change, reset both values to 0. Execute A4 and then we can view detail data in any of A3’s groups. Here are detailed records at TAISHAN station:
Then A5 generates the result table according to each group’s largest ascDay value and desDays value.
12. Intra-group operations and rankings
Contents and Exercise Data
SPL Official Website 👉 https://www.esproc.com
SPL Feedback and Help 👉 https://www.reddit.com/r/esProcSPL
SPL Learning Material 👉 https://c.esproc.com
SPL Source Code and Package 👉 https://github.com/SPLWare/esProc
Discord 👉 https://discord.gg/sxd59A8F2W
Youtube 👉 https://www.youtube.com/@esProc_SPL


Chinese version