

sg data smoothing(polynomial smoothing)
For some data with much the noise, it is usually necessary to smooth the data to reduce the noise.
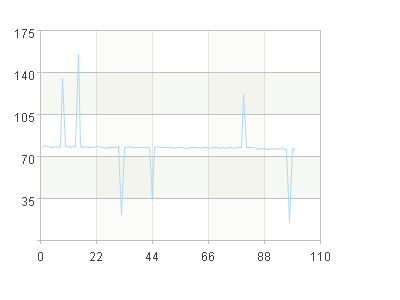
For example, a set of noisy data as below, use the sg() function to polynomial smooth the data
A |
|
1 |
=file("sgdata.xlsx").xlsimport@w() |
2 |
=A1.(~(1)) |
3 |
=A1.(~(2)) |
4 |
=sg(A3,1,15).conj() |
5 |
=canvas() |
6 |
=A5.plot("NumericAxis","name":"x") |
7 |
=A5.plot("NumericAxis","name":"y","location":2) |
8 |
=A5.plot("Line","markerStyle":0,"axis1":"x","data1":A2,"axis2":"y", "data2":A3) |
9 |
=A5.plot("Line","markerStyle":0,"lineColor":-65536,"axis1":"x","data1":A2,"axis2":"y", "data2":A4) |
10 |
=A5.draw@p(600,600) |
A1 Read the data as a secondary sequence
A2 The sequence number
A3 Original data
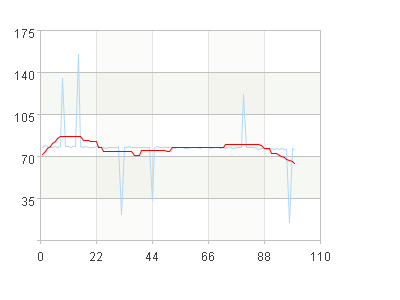
A4 Perform 15-point linear smoothing on A3 data (n=1,m=15), and return the smoothed data, as the red line in the figure. In sg(A,n,m,d), taking no derivative when the parameter d is omitted means smoothing only; d=1, indicating the smoothing result of the first derivative, which can eliminate the constant term error; d=2 Second derivative smooth, can eliminate the linear error
A5-A10 Draw the data before and after smoothing and observe the smoothing result. If the result is not good, the value of n, m, d can be adjusted until it is good.
SPL Official Website 👉 https://www.esproc.com
SPL Feedback and Help 👉 https://www.reddit.com/r/esProcSPL
SPL Learning Material 👉 https://c.esproc.com
SPL Source Code and Package 👉 https://github.com/SPLWare/esProc
Discord 👉 https://discord.gg/sxd59A8F2W
Youtube 👉 https://www.youtube.com/@esProc_SPL

