

The Five Types of SQL Senior Analysts Fear Most: They Can Write It, They Just Can’t Validate It
We’ve seen this scene far too often: someone needs to add a metric definition to a dbt model, or change a grouping condition in a report. In review, everyone thinks it’s simple, and one sentence is enough to explain it. But once the SQL has been changed, nobody dares to say, “This is definitely right.”
And the people who can write it are usually the most senior people in the team.
The problem is that once the change is made, the whole intermediate process gets compressed into a single final SQL statement. Where is the range boundary? When does the cumulative sum reset? How is the session boundary cut? Whose value did the gap actually take? Where do the dynamic column names come from? None of these questions can be read directly from the result table.
Senior analysts won’t admit to their team that they are unsure about the SQL results. They’ll just rerun the SQL and guess again.
These 5 types of SQL are where this situation comes up most often. If you’ve ever searched for “complex SQL help,” chances are one of them is what got you stuck.
“streak” problems: The winning streak is only the surface
Essentially, this kind of problems is to find the contiguous segments of records that meet a specified condition in a sequence of ordered records, then compute their lengths or their start and end positions.
They are not finance-specific problems. The same type of problem also shows up in counting consecutive login days, consecutive stockout days for a SKU, or how long a machine has been down. Take a stock‘’s consecutive rise as an example: find the start and end dates of the longest consecutive rising interval in a stock’s history.
The input is a stock quote table. Each row records the closing price of one stock on one day, and there are just 3 fields: CODE (stock code), DT (date), and CL (closing price). The goal is to output the start and end dates of the longest consecutive rise interval:
NoRisingDays |
start_date |
end_date |
1 |
2009-01-07 |
2009-01-12 |
2 |
2009-01-13 |
2009-01-16 |
The business logic is simple: sort data by date, check whether the closing price of the current date is higher than that of the previous date, flag the consecutive rise intervals, compute their lengths, find the longest one, and get its start and end positions.
But once it’s written in SQL, it looks like this (MySQL):
WITH seg AS (
    SELECT DT, CL,
        SUM(UpDownTag) OVER (ORDER BY DT) AS NoRisingDays
    FROM (
        SELECT DT, CL,
            CASE WHEN CL > LAG(CL) OVER (ORDER BY DT) THEN 0 ELSE 1 END AS UpDownTag
        FROM stock
        WHERE CODE = 100046
    ) flagged
),
counted AS (
    SELECT NoRisingDays, COUNT(*) AS ContinuousDays
    FROM seg
    GROUP BY NoRisingDays
)
SELECT NoRisingDays, MIN(DT) AS start_date, MAX(DT) AS end_date
FROM seg
WHERE NoRisingDays IN (
    SELECT NoRisingDays
    FROM counted
    WHERE ContinuousDays = (SELECT MAX(ContinuousDays) FROM counted)
)
GROUP BY NoRisingDays;
You don’t have to read this SQL line by line – just looking at the structure is enough: judging whether CL rises or falls, generating interval numbers, calculating interval lengths, finding the longest interval, and getting the start and end dates, all crammed into a single query. Although the interval numbers and interval lengths are each computed only once, the “longest interval” condition is stuffed into an IN subquery with one another layer of MAX nested inside. If you want to know which intervals get filtered out, you have to split the whole thing apart to run it piece by piece.
Being long isn’t the problem. The real problem is that all four intermediate states – rise/fall flags, interval numbers, interval lengths, and the longest interval – are hidden, and all you get in the end is a table of start & end dates. Once the result is wrong, you have no idea which layer went wrong. Is the segmentation condition wrong? Is the judgment of the longest interval off? Or did the dates get crossed between groups when they were passed along?
It’s not that you can’t write it – it’s that you can’t validate it. This point becomes especially concrete in this consecutive-interval scenario: you know what the logic is, but you have nowhere to stop and validate it.
There is an approach that brings these intermediate states back to the surface.
SQLazy is an intuitive, easy to understand language for structed data computing. It enables clear steps, deterministic output, and easy auditing. For a given task, it doesn’t require you to deliver the final result in one shot; instead, you write it out in business order:
1. First, filter data to get records of the target stock;
2. Sort records by date;
3. Segment records according to whether CL falls, and assign a number to every consecutive rise interval;
4. Count how many days each interval covers;
5. Find the interval having the most consecutive-rise days;
6. Get the start and end dates of this interval.
These six steps look like this in SQLazy:
stock:filter CODE = 100046
sort DT asc
segment CL down as NoRisingDays
compute count DT as ContinuousDays; partition NoRisingDays
rank ContinuousDays max
summarize min DT as start_date, max DT as end_date; group NoRisingDays
In the step-by-step code, the rise/fall flags, interval numbers, interval lengths, the longest interval, and start and end dates are all retained in the intermediate results. After step 3 is executed, you can directly see NoRisingDays – so you immediately know whether the interval boundaries are right. Once step 4 is executed, you can see how long each interval stretches. Only after step 5 finishes execution do you finally determine which interval is the longest. And when you need to fix something, you only have to go back to the step where the error occurred, not rewrite the whole thing from scratch.
Writing faster is just a byproduct. The real question is whether the analysis can be correctly delivered, pass review, and hold up in production – and that depends on whether every step is inspectable.
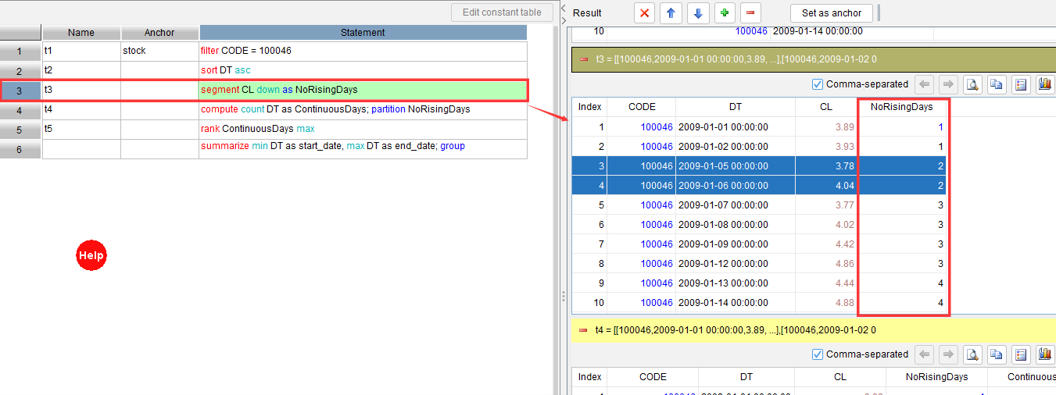
This example produces an interesting result when run in the Playground:
To run this example yourself, visit https://www.sqlazy.com/?4OY.
Note that this result contains two segments. If the data contains consecutive intervals of the same length, there will be more than one longest interval. This is why the intermediate states must be visible: you can’t tell whether the segmentation rule was applied correctly just by looking at these few lines of results.
These six steps are not the end goal – each step is executable and its result is visible, and the compiler then compiles them into native SQL. SQLazy isn’t tied to any particular database – the same sequence of steps can be compiled to different dialects such as MySQL, PsotgreSQL, Snowflake and Bigquery. The output is pure native SQL. You just copy and use it, with no vendor lock-in. The logic is described in human-readable steps, while what’s delivered to the database is still SQL.
These 6 steps aren’t the end of the line. Every step can be run and its result viewed, and in the end the compiler compiles them into native SQL. It isn’t tied to any one database: the same steps can be compiled into the dialects of MySQL, PostgreSQL, Snowflake, and BigQuery. What comes out is pure native SQL, ready to copy and use, with no vendor lock-in. The logic is steps people can read, and what’s delivered to the database is still SQL.
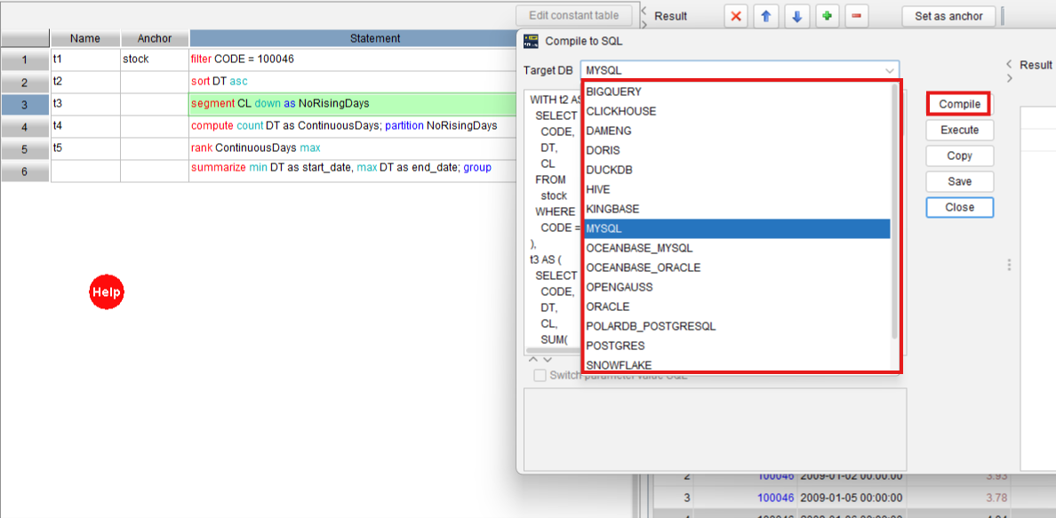
That’s what separates it from “writing an even longer SQL query”: every step is visible, so every step can be validated.
We won’t go into the remaining 4 types in detail. For each one, we’ll look at just one thing: can you see the intermediate result that’s been stumping you, directly?
Conditional accumulation: reset to zero at halfway through the accumulation
A cumulative sum is the simplest aggregation there is. But once the business logic adds one line, “start over whenever t appears,” it becomes two layers of windows nested together: first mark the reset point and then accumulate within each reset range.
There are only three columns in this example: id, logic, and val. Accumulate val in id order, and reset the output to 1 whenever logic=t; otherwise, continue the accumulation from the previous row.
Once it’s written in SQL, it looks like this (MySQL):
SELECT id, logic, val
    , SUM(CASE
        WHEN logic = 't' THEN 1
        ELSE val
    END) OVER (PARTITION BY logic_run ORDER BY CASE
        WHEN id IS NULL THEN 1
        ELSE 0
    END, id ASC ROWS UNBOUNDED PRECEDING) AS output
FROM (
    SELECT id, logic, val,
        SUM(CASE
            WHEN logic = 't' THEN 1
            ELSE 0
        END) OVER (ORDER BY CASE
            WHEN id IS NULL THEN 1
            ELSE 0
        END, id ASC ROWS UNBOUNDED PRECEDING) AS logic_run
    FROM table_t1
) calc
ORDER BY CASE
    WHEN id IS NULL THEN 1
    ELSE 0
END, id ASC;
The most important intermediate column in this SQL is logic_run. It marks which row triggered a reset, and the cumulative sum that follows is grouped by that reset range. But it’s buried in the inner subquery and never shows up in the final result. To check whether the output is right, you have to compare it against the original data, cell by cell, by hand.
In SQLazy, this is split into 3 steps: sort by id, then flag the reset condition, and then acumulate within each rest range. Look at logic_run first, and you can see at a glance whether the reset points are right. Then look at output, and you can immediately confirm whether the cumulative sum carried on along the correct ranges.
table_t1:sort id asc
compute if(logic="t" then 1 else 0) cum as logic_run
compute if(logic="t" then 1 else val) cum as output partition logic_run
To see how logic_run and output are computed step by step, you can run the code directly:
sessionization: When should you start a new session?
One account may show up several times a day. Which chats are treated as the same session is determined by the time between two events. Which visits count as one session depends on how much time passes between two events. That is sessionization: splitting a run of events into sessions by time gap or by a change of state.
The scenario includes an event stream for accounts, and the table has just two columns: account and time. If two events are more than an hour apart, a new session starts.
When it’s written in SQL, it looks like this (MySQL):
SELECT account_number, dt,
    ROW_NUMBER() OVER (PARTITION BY account_number, grp ORDER BY account_number ASC, dt ASC) AS seq
FROM (
    SELECT account_number, dt, 1 + SUM(CASE
            WHEN col__2 + INTERVAL 3600 SECOND <= dt THEN 1
            ELSE 0
        END) OVER (PARTITION BY account_number ORDER BY account_number ASC, dt ASC) AS grp
    FROM (
        SELECT event_tb.*, LAG(dt) OVER (PARTITION BY account_number ORDER BY account_number ASC, dt ASC) AS col__2
        FROM event_tb
    ) sub__3
) t3
ORDER BY account_number ASC, dt ASC;
This SQL uses two layers of windows: one judges the time gap and generates the session groups, and the other numbers the rows within each group. The two layers are also hidden in different subquery layers. To understand seq, you have to go to the innermost layer and look at col_2, then work outward to grp, and finally get to seq. The trouble is that the session boundary grp isn’t output, so you can’t tell from the result whether the numbers are right.
On the row that comes more than an hour after the previous one, seq starts over from 1. But how that was determined, the result gives no clue.
SQLazy needs just 3 steps: sort, segment by time gap, and number within each group. Once the segmentation step runs, grp and seq are both in the table, so you don’t need to guess where the boundaries fall.
event_tb:sort account_number asc dt asc
segment condition ((dt[-1] elapse 3600 second)<= dt) partition account_number as grp
compute # as seq partition account_number grp
Visit https://www.sqlazy.com/?4M4 to find the 3 steps: sort, segment and number.
Gap filling: NULL is not empty – the previous value should carry forward.
The scariest thing in a report isn’t wrong numbers, it’s blanks. In the dept column, several rows are NULL. The business requirement is simple: fill them in.
A simple employee table reproduces this: id, name, dept. Row 2 has a blank dept, which inherits Marketing from row 1; rows 4 and 5 have blank depts, which inherit Sales from row 3.
The business requirement only says “fill them in,” but in SQL it takes several layers: first build the groups, then find the valid value, and finally write it back to the original row. Once the filling is done, nobody can say for sure which row a given NULL took its value from.
Write this logic in SQL (MySQL):
SELECT id, name, filled_dept AS dept
FROM (
    SELECT id, name, dept, grp
        , MAX(dept) OVER (PARTITION BY grp) AS filled_dept
    FROM (
        SELECT id, name, dept
            , SUM(CASE
                WHEN dept IS NOT NULL THEN 1
                ELSE 0
            END) OVER (ORDER BY CASE
                WHEN id IS NULL THEN 1
                ELSE 0
            END, id ASC ROWS UNBOUNDED PRECEDING) AS grp
        FROM forwardFill
    ) g
) f
ORDER BY CASE
    WHEN id IS NULL THEN 1
    ELSE 0
END, id ASC;
In this SQL, grp determines which segment each null falls in, and MAX(dept) backfills the valid value from this segment into the null. grouping and backfillING are buried in two separate subqueries: grp isn’t output, and although filled_dept is renamed to dept for output, so you have no way to verify which row it actually inherited its value from.
With SQLazy, this takes 4 steps: flag the non-null values, group by consecutive range, take the valid value from each group, and write it back to the original table. Once step 2 runs, you can confirm which segment a null belongs to. When step 3 is executed, you can confirm the exact value it took.
forwardFill:sort id asc
compute if ((dept notnull) then 1 else 0) cum as grp
compute max dept as filled_dept; partition grp
derive id, name, filled_dept as dept
Visit https://www.sqlazy.com/?39E to run the 4 steps.
Dynamic pivot: Column names are not fixed
What the business team wants is a wide table: one row per time point, one column per order. But in the original data, the three time points correspond to three columns, and the order information is in rows. This is a dynamic pivot: column names follow the data.
The example is a flow record for four orders. Each row has ID, PartNum, EnteredOn, PickedTime, and DeliveredTime. The requirement is to turn these three time columns into a long table of “event type + time”, then combine PartNum and ID into column names, and finally pivot it into a wide table.
In SQL, this kind of requirement crams column-to-row transposition, state transformation, dynamic column-name concatenation, and re-pivoting all together. The final wide table looks neat and tidy, but you can’t tell from the result at all how the intermediate column names were derived or at which step the state values were changed.
The complete SQL looks like this (MySQL):
SELECT t_stamp,
    MIN(CASE WHEN col_name = '50A_100' THEN FIRST_2 END) AS `50A_100`,
    MIN(CASE WHEN col_name = '60B_125' THEN FIRST_2 END) AS `60B_125`,
    MIN(CASE WHEN col_name = '50A_171' THEN FIRST_2 END) AS `50A_171`,
    MIN(CASE WHEN col_name = '70B_211' THEN FIRST_2 END) AS `70B_211`
FROM (
    SELECT t_stamp, col_name, status,
        FIRST_VALUE(status) OVER (PARTITION BY t_stamp, col_name ORDER BY NULL) AS FIRST_2
    FROM (
        SELECT ID, PartNum, action_type, t_stamp,
            CASE
                WHEN action_type = 'EnteredOn' THEN 'ENTERED'
                WHEN action_type = 'PickedTime' THEN 'PICKED'
                WHEN action_type = 'DeliveredTime' THEN 'DELIVERED'
                ELSE NULL
            END AS status,
            concat_ws('', PartNum, '_', ID) AS col_name
        FROM (
            SELECT ID, PartNum, action_type, t_stamp
            FROM (
                SELECT ID, PartNum, 'EnteredOn' AS action_type, EnteredOn AS t_stamp FROM tb
                UNION ALL
                SELECT ID, PartNum, 'PickedTime' AS action_type, PickedTime AS t_stamp FROM tb
                UNION ALL
                SELECT ID, PartNum, 'DeliveredTime' AS action_type, DeliveredTime AS t_stamp FROM tb
            ) u
            WHERE t_stamp IS NOT NULL
        ) f
    ) s
) v
GROUP BY t_stamp;
Column names like 50A_100 don’t exist in the original table, and ENTERED isn’t the original value either. Both are generated in intermediate steps, and these steps are compressed to a 4-layer nesting. status, col_name, and FIRST_2 – none of them show up in the final wide table. The origins of the column names and values leave no trace in the final wide table.
Achieving the same goal takes 6 steps in SQLazy: unpivot columns to rows, filter out nulls, convert states, generate the dynamic column names, tidy up the intermediate fields, and pivot again. The result of each step can be viewed individually, so there’s no need to guess where a column’s name and values come from.
To see how dynamic column names are generated, vist https://www.sqlazy.com/?2Yx to run this example.
In closing: You can only validate what you can see
These five types of problems look like five separate things on the surface: segmenting intervals, resetting accumulation, sessionizing, filling gaps, and pivoting to a wide table.
At bottom, they are one and the same thing: they all need to be done in steps, yet SQL only lets you hand in one final result.
It’s not that you can’t write it – it’s that you can’t validate it.
Writing it isn’t hard – what’s hard is proving that every step is correct. Anyone who has done dbt optimization knows this best: change one definition, and the entire pipeline has to be re-validated.
Only when it’s visible can it be validated
SQLazy breaks the process into ordered steps, each of which can be executed and its result inspected. AI helps plan the business logic into steps, and the compiler compiles those steps into native SQL. The logic is for humans to read; the SQL is for machines to run.
If you want to really break a complex SQL query apart and look at it piece by piece, all five examples can be run directly in the Playground, and the links are at the end of each section. For more examples of sessionization, consecutive intervals, dynamic grouping, and report transformation, check out the example library: https://github.com/SPLWare/SQLazy/tree/master/examples.
Of these 5 types of SQL, which one do you dread most?
SPL Official Website 👉 https://www.esproc.com
SPL Feedback and Help 👉 https://www.reddit.com/r/esProcSPL
SPL Learning Material 👉 https://c.esproc.com
SPL Source Code and Package 👉 https://github.com/SPLWare/esProc
Discord 👉 https://discord.gg/sxd59A8F2W
Youtube 👉 https://www.youtube.com/@esProc_SPL


chinese version https://c.raqsoft.com.cn/article/1792548148110