How to perform difference set operation on continuous intervals with esProc
There are two tables in a certain database. The original inventory table data_add stores multiple batches of inventory for multiple items. Each batch of inventory has a starting number START_NUM and an ending number END_NUM, representing the range of an interval.
ID |
ITEM_ID |
START_NUM |
END_NUM |
1 |
337 |
101 |
400 |
2 |
337 |
500 |
800 |
3 |
337 |
801 |
1200 |
4 |
337 |
1500 |
1600 |
5 |
337 |
15000 |
16000 |
6 |
337 |
20000 |
30000 |
7 |
444 |
20 |
30 |
The consumption table data_cons stores multiple batches of consumption for multiple items, with each batch of consumption being an interval.
ID |
ITEM_ID |
START_NUM |
END_NUM |
1 |
337 |
240 |
300 |
2 |
337 |
301 |
400 |
3 |
337 |
850 |
1100 |
4 |
337 |
1500 |
1510 |
5 |
337 |
15000 |
16000 |
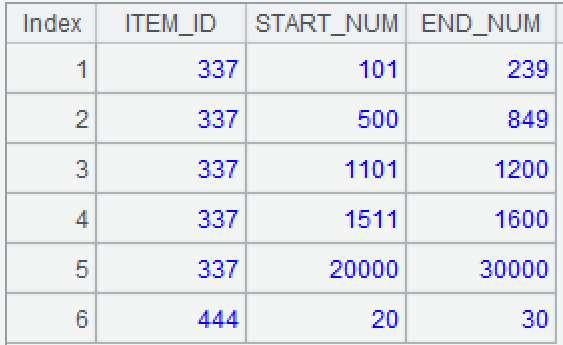
Now we need to calculate the current inventory of each item, which is the difference set between the multi segment range of the original inventory and the multi segment range of consumption, and represent the result as a multi segment range. The interval of the original inventory may be consumed into discontinuous multiple intervals, in which case multiple records need to be naturally generated, with each record corresponding to an interval. For example, the interval of the original inventory [500:1200] is consumed into two intervals [500:849] and [1101:1200].
ITEM_ID |
START_NUM |
END_NUM |
337 |
101 |
239 |
337 |
500 |
849 |
337 |
1101 |
1200 |
337 |
1511 |
1600 |
337 |
20000 |
30000 |
444 |
20 |
30 |
SQL cannot represent sets with variables, making it inconvenient to perform operations between sets, and the code is very cumbersome. SPL can represent sets with variables, making it easy to express various set operations:
https://try.esproc.com/splx?3xM
A |
B |
|
1 |
$select * from data_add.txt |
$select * from data_cons.txt |
2 |
=A1.group(ITEM_ID;~.conj(to(START_NUM,END_NUM)):a) |
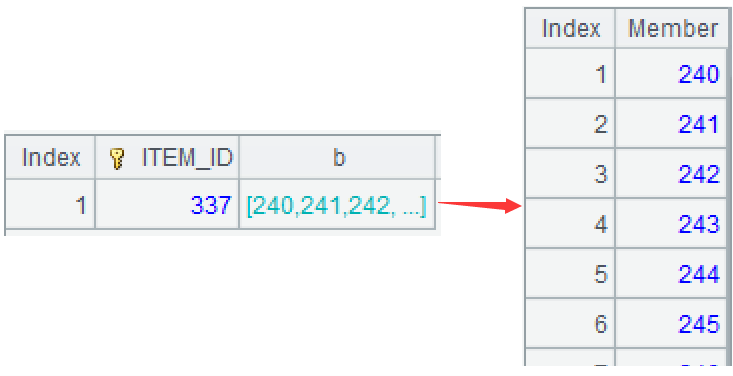
=B1.group(ITEM_ID;~.conj(to(START_NUM,END_NUM)):b) |
3 |
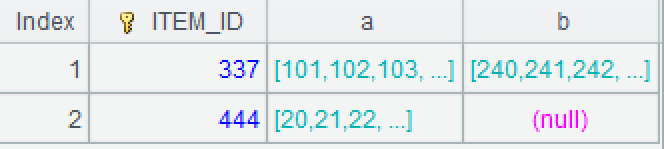
=A2.join(ITEM_ID,B2,b) |
|
4 |
=A3.derive([a, b].merge@d().group@i(~!=~[-1]+1):diff) |
|
5 |
=A4.news(diff; ITEM_ID, ~1:START_NUM, ~.m(-1):END_NUM) |
|
A1-B1: Load data.
A2: Use the group function to group the original inventory by item, but do not aggregate. Convert each interval within the group into a small set of continuous sequence, and then union them into a large set. ~ represents the current group, the function 'to' can generate a continuous sequence based on the start and end numbers.
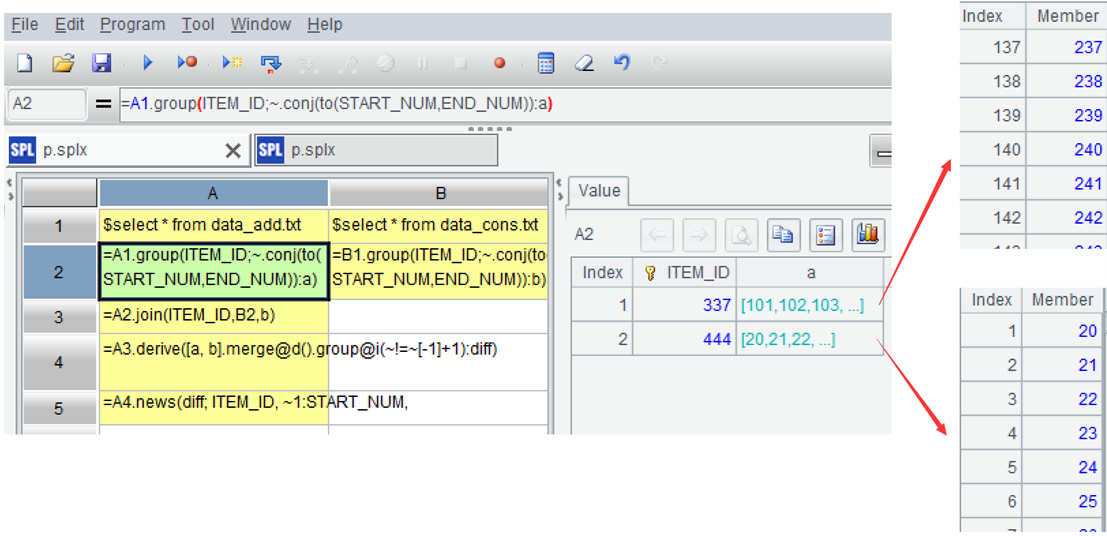
B2: Apply the same processing to the consumption table.
A3=A2.join(ITEM_ID,B2,b):Use the join function to perform left join by item ID.
A4=A3.derive([a, b].merge@d()…..) Add a calculated column and first calculate the difference between the original inventory set and the consumption set of each item. The merge function merges ordered sets, @d represents calculating the difference set. Note that the sequence after the difference set is discontinuous, such as 849 and 1101.
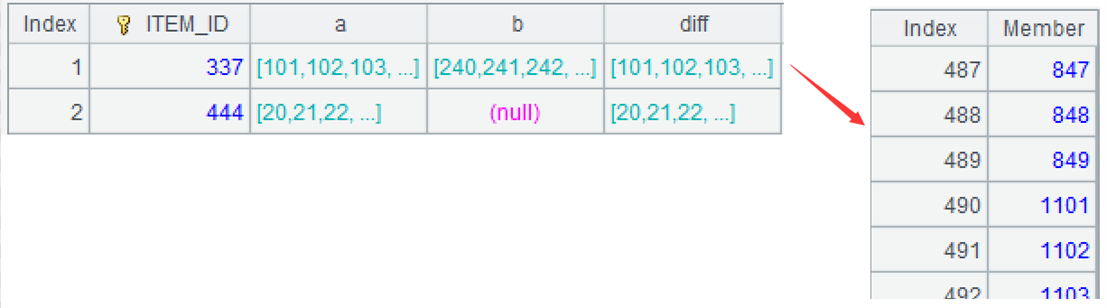
group@i(~!=~[-1]+1)Then perform conditional grouping to each difference set, grouping the consecutive sequence into the same group, such as 849 and 1101 being assigned to the second and third groups, respectively. The function group is used for grouping, by default is equivalence grouping, @i represents grouping by condition, and ~[-1] represents the previous member.
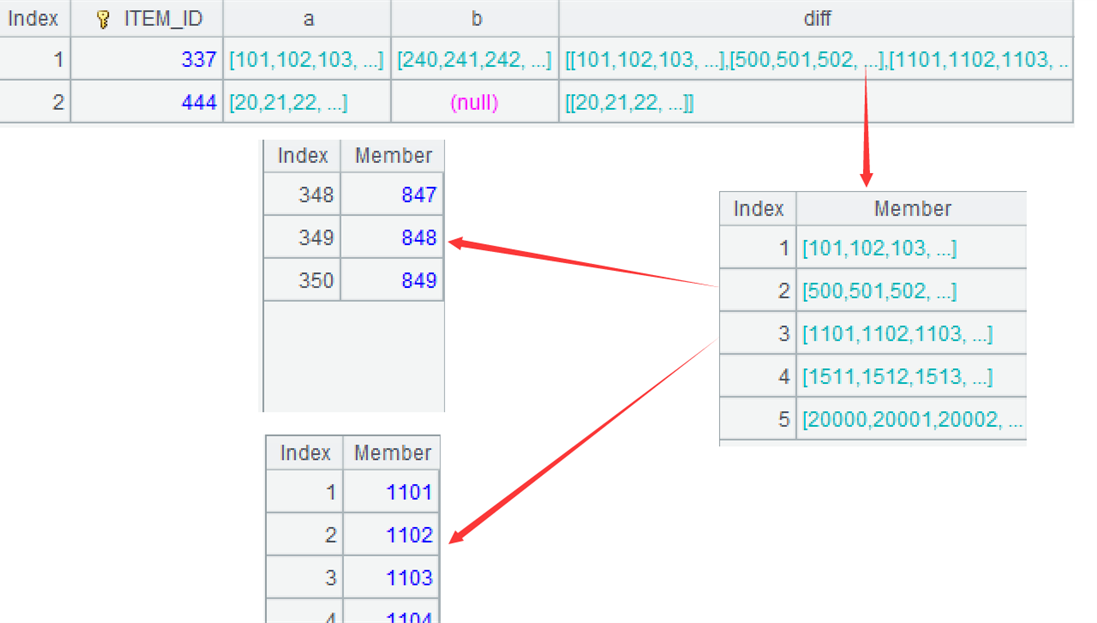
A5=A4.news(diff; ITEM_ID, ~1:START_NUM, ~.m(-1):END_NUM)Generate a new record using each sequence in the diff field of each record in A4, where the start and end numbers of the new interval are taken from the beginning and end of each sequence. The function news can expand each member of a set into one record. ~.m(-1) represents the last member in ~, ~.m(1) represents the first member in ~, abbreviated as ~1.
SPL Official Website 👉 https://www.esproc.com
SPL Feedback and Help 👉 https://www.reddit.com/r/esProcSPL
SPL Learning Material 👉 https://c.esproc.com
SPL Source Code and Package 👉 https://github.com/SPLWare/esProc
Discord 👉 https://discord.gg/sxd59A8F2W
Youtube 👉 https://www.youtube.com/@esProc_SPL