

Data Analysis Programming from SQL to SPL: Scores
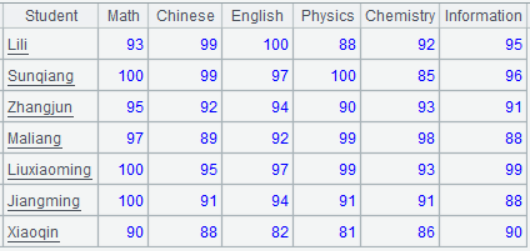
The following is an example of the student score table, ‘score’:
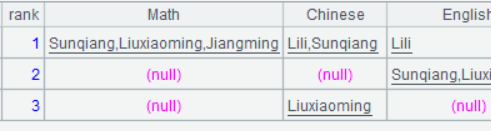
1. Calculate the top 3 students in each subject
The calculation results should be displayed as follows: each rank on a separate row, each subject in a separate column, with students of the same rank comma-separated:
Since the format of the calculation results is fixed, we can first generate an empty result set for each subject, then calculate the student(s) for each rank and populate the set with ranked students. To implement this logic in SQL, each rank of each subject needs to be enumerated, leading to verbose code. Therefore, a workaround is needed as shown below:
with t as (select Student, 'Math' Course, Math score from score
    union all select Student, 'Chinese' Course, Chinese from score
    union all select Student, 'English' Course, English from score
    union all select Student, 'Physics' Course, Physics from score
    union all select Student, 'Chemistry' Course, Chemistry from score
    union all select Student, 'Information' Course, Information from score
),
t1 as (select Student, Course,
    rank() over(partition by Course order by score desc) Rnk
    from t
),
t2 as (select Course, Rnk, group_concat(Student) Students
    from t1
    where Rnk<=3
    group by Course,Rnk
)
select Rnk `Rank`,
    max(if(Course='Math',Students,null)) Math,
    max(if(Course='Chinese',Students,null)) Chinese,
    max(if(Course='English',Students,null)) English,
    max(if(Course='Physics',Students,null)) Physics,
    max(if(Course='Chemistry',Students,null)) Chemistry,
    max(if(Course='Information',Students,null)) Information
from t2
group by rnk;
Due to the absence of grouped subsets in SQL, calculations cannot be performed directly on subsets. As a result, the data structure must be transformed by placing the scores of each subject in one column to facilitate ranking and aggregation of student names together. After computing the results, another grouping operation is required to transform the data structure back to its original state. Moreover, dynamically handling column names and obtaining the column count in SQL is not easy, necessitating enumeration of each column when transforming the structure.
In contrast, SPL can easily obtain column names and column counts, allowing for the pre-generation of an empty result structure with dynamic columns. Moreover, SPL’s sets are ordered, enabling data to be accessed by position and calculated by sequence. Furthermore, SPL has the concept of subsets, making it easy to access the data subset of each rank and directly calculate the results:
A |
|
1 |
=file("score.txt").import@t() |
2 |
=3.new(#:rank,${A1.fname().to(2,).(":"/~).concat@c()}) |
3 |
=A2.run( r=~, to(2,A1.fno()).run( c=~ , s1=A1.select@a (A1.field(c).rank@z (~.field(c))==rank) , r.field(c,s1) , s2=if(s1.len()>=1, s1.(Student).concat@c()) , r.field(c,s2) ) ) |
In A2, 3.new() generates three rows of records for the top three ranks, with # representing the row number, looping from 1 to 3.
The fname() function obtains all original field names. Subsequently, to(2,) removes the first field, yielding all subject names.
${name of each subject} is the macro syntax. The string calculated from the macro expression is then concatenated to the outer expression, which increases the expression’s flexibility.
The SPL IDE offers high interactivity, enabling step-by-step execution and providing an intuitive view of each step’s result in the right-hand panel at any time. Selecting the executed A2 displays the resulting empty result structure on the right.

A3 loops through each row and each column. r is the record of the current row, and c is the index of the current column. Use these indexes to retrieve the relevant data, calculate the subset of students, denoted s1, for each subject and each rank, and use the field() function to assign the resulting subsets to the current positions, confirming their validity.
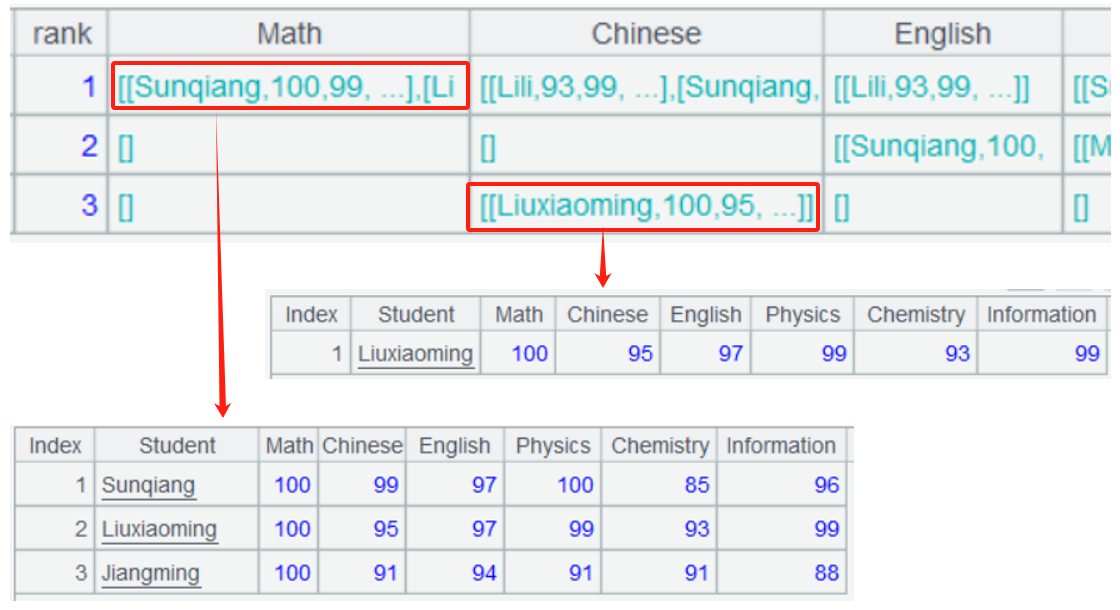
Continuing to use these subsets s1 to concatenate to comma-separated equally-ranked students s2, then use the field() function to update the current position with s2, thereby completing the statistical process.
2. Add a column to original table: Best-performing subject(s)
Because SQL’s data sets are unordered, the calculation results cannot be guaranteed to match the original table order. Therefore, an index field must be manually added, and the calculation results must then be sorted by this index. This is the only way to ensure a correct resulting order.
To find the highest score within a row, SQL still necessitates grouping and then ranking. Moreover, these calculations cannot be performed directly on the in-row data set. Instead, the data structure must first be transformed to put the scores in one column, then transformed back after the calculation. Consequently, writing such SQL would be too cumbersome, so we will not attempt it here. Interested readers can try it themselves.
SPL supports ordered sets, which can keep the original order. In addition, SPL allows for the flexible combination of data. Data with the same row/column or across rows/columns can be selected as a subset to perform calculations. The calculation results can then be updated (or inserted) at any position:
A |
|
1 |
=file("score.txt").import@t() |
2 |
=A1.fname() |
3 |
=A1.derive(A2(~.array().ptop(-1,if(#>1,~))).concat@c():Best) |
A2 uses fname() to retrieve all field names.
In A3, ~ represents the current row; ~.array() obtains a subset containing all field values from the current row; ptop() identifies the position(s) of the highest score within the subset, then the subject name(s) are retrieved from A2 corresponding to these position(s). After concatenating these subject names, the derive() function adds the concatenated string as a new field Best.
3. List the scores (for all students) of the subjects that are below 90 for student Maliang
SQL can only handle such dynamic columns through stored procedures.
SPL’s sets are ordered, making it easy to find data and its position. Additionally, SPL simplifies both column name retrieval and dynamic column generation using macros:
A |
|
1 |
=file("score.txt").import@t() |
2 |
=A1.select@1(Student:"Maliang") |
3 |
=A2.array().pselect@a(#>1 && ~<90) |
4 |
=A1.fname()(A3).concat@c() |
5 |
=A1.new(Student, ${A4}) |
A3 uses the pselect() function to search Maliang’s score records for the column positions where the scores are below 90. A4 concatenates the subject names corresponding to the positions identified in A3. A5 uses a macro to generate dynamic columns based on A4.
SPL Official Website 👉 https://www.esproc.com
SPL Feedback and Help 👉 https://www.reddit.com/r/esProcSPL
SPL Learning Material 👉 https://c.esproc.com
SPL Source Code and Package 👉 https://github.com/SPLWare/esProc
Discord 👉 https://discord.gg/sxd59A8F2W
Youtube 👉 https://www.youtube.com/@esProc_SPL


Chinese Version