Group columns of an Excel table and perform aggregation
In the Excel table below, there are multiple duplicate columns.
A |
B |
C |
D |
E |
F |
G |
H |
|
Alpha |
Alpha |
Beta |
Beta |
Alpha |
Delta |
Beta |
||
1 |
A |
0.56 |
0.1 |
0.55 |
0.74 |
0.38 |
0.02 |
0.44 |
2 |
B |
0.06 |
0.32 |
0.22 |
0.55 |
0.9 |
0.7 |
0.38 |
3 |
C |
0.16 |
0.08 |
0.63 |
0.9 |
0.7 |
0.78 |
0.2 |
4 |
D |
0.8 |
0.92 |
0.03 |
0.57 |
0.48 |
0.52 |
0.28 |
5 |
E |
0.47 |
0.21 |
0.81 |
0.4 |
0.68 |
0.8 |
0.13 |
6 |
F |
0.39 |
0.19 |
0.76 |
0.88 |
0.69 |
0.81 |
0.81 |
We need to group the table by columns and sum values in each group.
A |
B |
C |
D |
|
10 |
Alpha |
Beta |
Delta |
|
11 |
A |
1.04 |
1.73 |
0.02 |
12 |
B |
1.28 |
1.15 |
0.7 |
13 |
C |
0.94 |
1.73 |
0.78 |
14 |
D |
2.2 |
0.88 |
0.52 |
15 |
E |
1.36 |
1.34 |
0.8 |
16 |
F |
1.27 |
2.45 |
0.81 |
Use SPL XLL to get this done:
=spl("=E@2bp(E@bp(?).groups(#1;${(?.len()-1).(eval@s($[sum(#?)],#+1)).concat@c()}))",B1:H7)
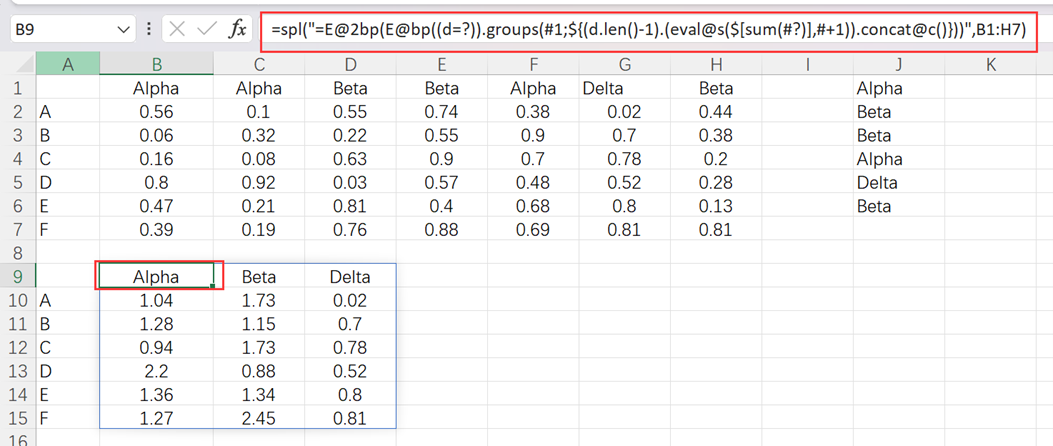
E()function converts an Excel table to a two-layer sequence; @p option enables a transposition, @b means not converting the titles, and @2 represents a two-layer sequence. groups() performs grouping and sum; ${} treats a string as an expression to execute. eval@s() loops each string in a sequence to replace them and takes them as an expression to execute. concat@c concatenates members of the sequence using the comma.
SPL Official Website 👉 https://www.esproc.com
SPL Feedback and Help 👉 https://www.reddit.com/r/esProc_Desktop/
SPL Learning Material 👉 https://c.esproc.com
Discord 👉 https://discord.gg/sxd59A8F2W
Youtube 👉 https://www.youtube.com/@esProcDesktop
Linkedin Group 👉 https://www.linkedin.com/groups/14419406/