Group and summarize a table where every N rows consist of a range by column
Below is an Excel table. Every two rows form a range; and in each range, each pair of cells up and down is regarded as a piece of data that stores client and working hours that can be empty.
A |
B |
C |
D |
E |
F |
G |
|
1 |
Alpha |
Alpha |
Alpha |
Alpha |
Bravo |
Bravo |
Bravo |
2 |
10 |
10 |
10 |
10 |
10 |
10 |
10 |
3 |
Bravo |
Alpha |
Bravo |
Alpha |
Alpha |
Alpha |
Bravo |
4 |
11 |
11 |
11 |
11 |
11 |
11 |
We need to find the hours of work for each client.
I |
J |
|
1 |
Client site |
Hrs worked |
2 |
Alpha |
84 |
3 |
Bravo |
52 |
Use SPL XLL to do this:
=spl("=E@b(?.group((#-1)\2).conj(E@pb(~)).groups(#1;sum(#2)))",A1:G4)
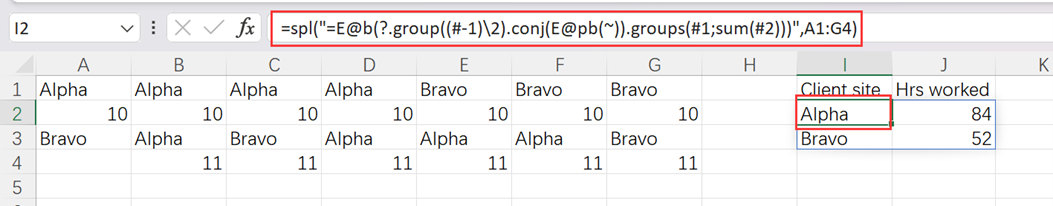
group()function groups rows and retains the grouping result details. groups() function performs grouping and aggregation; # represents the current sequence number in a sequence, and ~ is the current member of a sequence. E@pb converts a sequence to a table sequence without column headers.
SPL Official Website 👉 https://www.esproc.com
SPL Feedback and Help 👉 https://www.reddit.com/r/esProc_Desktop/
SPL Learning Material 👉 https://c.esproc.com
Discord 👉 https://discord.gg/sxd59A8F2W
Youtube 👉 https://www.youtube.com/@esProcDesktop
Linkedin Group 👉 https://www.linkedin.com/groups/14419406/