Summarize data every two columns under each category
In the Excel table below, column A contains categories and there are 2N key-value formatted columns after it:
A |
B |
C |
D |
E |
F |
G |
|
1 |
Country |
Label1 |
Count1 |
Label2 |
Count2 |
Label3 |
Count3 |
2 |
US |
A |
10 |
B |
9 |
C |
8 |
3 |
US |
D |
9 |
C |
8 |
A |
7 |
4 |
US |
C |
8 |
D |
7 |
B |
6 |
5 |
US |
A |
7 |
C |
6 |
B |
5 |
6 |
CA |
A |
10 |
B |
9 |
C |
8 |
7 |
CA |
D |
9 |
C |
8 |
A |
7 |
8 |
CA |
C |
8 |
D |
7 |
B |
6 |
9 |
IN |
A |
10 |
C |
9 |
B |
8 |
10 |
IN |
D |
9 |
A |
8 |
B |
7 |
11 |
IN |
A |
8 |
D |
7 |
B |
6 |
We need to group rows by the category and the key, and perform sum on detail data. The expected result set will have 3 columns. Note that the result set should be arranged according to the original order of the category column.
A |
B |
||
1 |
Country |
Label |
Total |
2 |
US |
A |
24 |
3 |
US |
B |
20 |
4 |
US |
C |
30 |
5 |
US |
D |
16 |
6 |
CA |
A |
17 |
7 |
CA |
B |
15 |
8 |
CA |
C |
24 |
9 |
CA |
D |
16 |
10 |
IN |
A |
26 |
11 |
IN |
C |
9 |
12 |
IN |
B |
21 |
Use SPL XLL to enter the following formula and drag it down:
=spl("=E(?).groupc@r(Country;;Label,Count).groups@u(Country,Label;sum(Count):Total)",A1:G11)
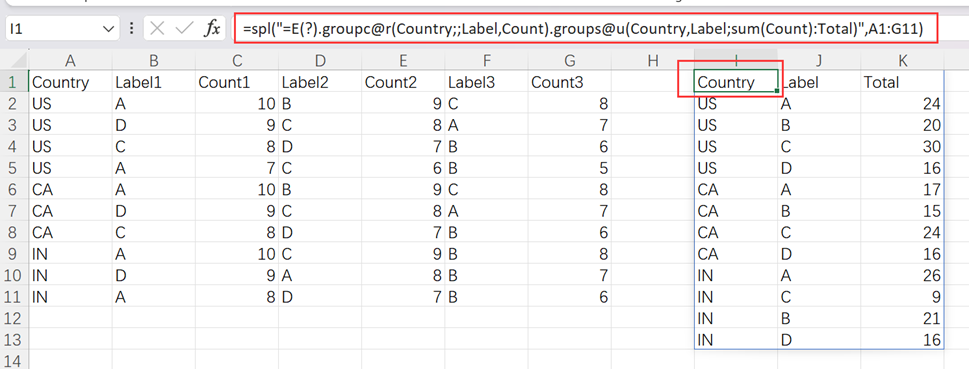
E()function reads data as its original table format. groupc@r performs column-to-row transposition by putting every n columns in one group. groups() function performs grouping & aggregation.
Source:https://www.reddit.com/r/excel/comments/1cz218j/how_can_i_summarize_a_table_with_location/
SPL Official Website 👉 https://www.esproc.com
SPL Feedback and Help 👉 https://www.reddit.com/r/esProc_Desktop/
SPL Learning Material 👉 https://c.esproc.com
Discord 👉 https://discord.gg/sxd59A8F2W
Youtube 👉 https://www.youtube.com/@esProcDesktop
Linkedin Group 👉 https://www.linkedin.com/groups/14419406/