In Excel, group & summarize data by header row without adding a helper column
There are multiple Excel worksheets that have same structure but different number of rows. The 2nd row is the header row, and the last row is the summary row. The data layout is vertical. Here are the four tables:
A |
B |
C |
D |
|
1 |
Name |
Entered Calls |
Accepted Calls |
Accept % |
2 |
Team Leader A |
|||
3 |
Agent 1 |
100 |
50 |
50% |
4 |
Agent 2 |
100 |
60 |
60% |
5 |
Agent 3 |
100 |
70 |
70% |
6 |
Agent 4 |
100 |
80 |
80% |
7 |
Agent 5 |
100 |
90 |
90% |
8 |
Totals |
500 |
350 |
70% |
9 |
Name |
Entered Calls |
Accepted Calls |
Accept % |
10 |
Team Leader B |
|||
11 |
Agent 6 |
101 |
50 |
50% |
12 |
Agent 7 |
100 |
60 |
60% |
13 |
Agent 8 |
100 |
70 |
70% |
14 |
Agent 9 |
100 |
80 |
80% |
15 |
Agent 10 |
100 |
90 |
90% |
16 |
Totals |
501 |
350 |
70% |
17 |
Name |
Entered Calls |
Accepted Calls |
Accept % |
18 |
Team Leader C |
|||
19 |
Agent 11 |
102 |
50 |
50% |
20 |
Agent 12 |
100 |
60 |
60% |
21 |
Agent 13 |
100 |
70 |
70% |
22 |
Agent 14 |
100 |
80 |
80% |
23 |
Agent 15 |
100 |
90 |
90% |
24 |
Totals |
502 |
350 |
70% |
25 |
Name |
Entered Calls |
Accepted Calls |
Accept % |
26 |
Team Leader D |
|||
27 |
Agent 16 |
104 |
50 |
50% |
28 |
Agent 17 |
100 |
60 |
60% |
29 |
Agent 18 |
100 |
70 |
70% |
30 |
Agent 19 |
100 |
80 |
80% |
31 |
Agent 20 |
100 |
90 |
90% |
32 |
Totals |
504 |
350 |
70% |
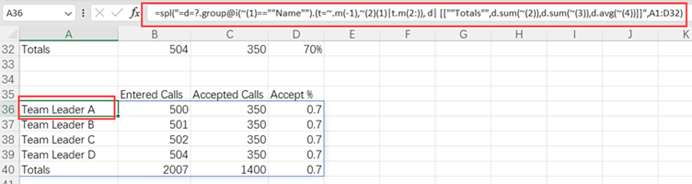
Group and summarize data by the header row without adding a helper column, and make the last row the total row:
A |
B |
C |
D |
|
1 |
Entered Calls |
Accepted Calls |
Accept % |
|
2 |
Team Leader A |
500 |
350 |
0.7 |
3 |
Team Leader B |
501 |
350 |
0.7 |
4 |
Team Leader C |
502 |
350 |
0.7 |
5 |
Team Leader D |
504 |
350 |
0.7 |
6 |
Totals |
2007 |
1400 |
0.7 |
Use SPL XLL to enter the following formula:
=spl("=d=?.group@i(~(1)==""Name"").(t=~.m(-1),~(2)(1)|t.m(2:)), d| [[""Totals"",d.sum(~(2)),d.sum(~(3)),d.avg(~(4))]]",A1:D32)
The group@i function generates new groups whenever the specified condition is met; ~ represents the current group, and ~.m(-1) represents the last member/row. The code in rear is for aggregation and can be replaced by an Excel formula.
Source: https://stackoverflow.com/questions/78415314/sumifs-rows-based-on-header
SPL Official Website 👉 https://www.esproc.com
SPL Feedback and Help 👉 https://www.reddit.com/r/esProc_Desktop/
SPL Learning Material 👉 https://c.esproc.com
Discord 👉 https://discord.gg/sxd59A8F2W
Youtube 👉 https://www.youtube.com/@esProcDesktop
Linkedin Group 👉 https://www.linkedin.com/groups/14419406/